
Public schools in rural Minnesota receive $683 per pupil less than their counterparts in the metro area, according to a new data analysis released today by MREA. This stems from a large and pervasive gap in the median household income that is $23,422 less in rural Minnesota than the metro area, according to the analysis of data from the U.S. Census 2017 American Community Survey.
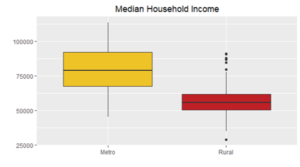
Median Household Income at a Glance:
- $79,058 in 7-County Metro
- $55,636 in Rural
- $57,151 Statewide
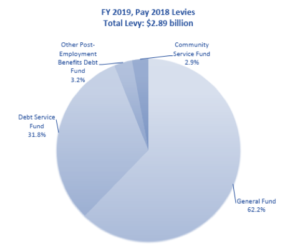 Household income has a direct impact on buying power. Minnesotans paid $2.9 billion in local property taxes to support education of students in their communities for 2019. Nearly all the property taxes are voter approved.
Homeowners and non-homestead residential property owners will pay 56 percent of the estimated $998 million in school districts’ school bond debt service payments alone in 2019.
Buying Power
Passage rates in rural Minnesota have been about 40-60% lower than metro passage rates for both school facility bonds and operating referendum revenue. Learn more
 How much buying power do rural households have?
The median metro district falls in the 96th percentile of Minnesota rural districts, as shown by the chart to the left. That means only 4 percent of rural districts are wealthier per household than half of the metro districts. The median rural district lands in the 14th percentile of metro districts.
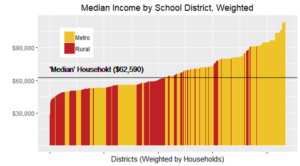 What’s the impact of the number of households?
When the number of households in districts is accounted for, the wealth disparity becomes even more significant, as shown by the chart to the right. About 62 percent of Minnesota’s 2.2 million households are in metro districts while 38 percent are in rural districts.
 Metro households have 50 percent more buying power for everything, including property taxes. When measured this way, the statewide median household income increases about $5,400 to $62,590. The new median would be the 77th percentile in rural districts, and is only the 20th percentile of metro districts.
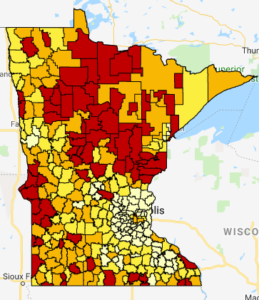
What is your district’s median household income?
Those shaded in red in the map to the left fall in the lowest quartile. Orange districts are below the median while those in the darker yellow are above the median. The lightest yellow reflects districts in the highest quartile. View interactive map
Impact on Passage Rates
So does the 2:3 ratio for household income ratio also apply to passage rates? If 80 percent of metro bonds pass, then the expected passage rate for rural bonds should be 53 percent — which was the historical pattern.
Reaching 68 percent in November 2018 can be clearly attributed to the state picking up a larger share of the cost of school facilities with the roll out of Ag2School. This year marks the first year that the 40% Ag2School tax credit on school bonds for agriculture and timber land owners took effect. Benson Superintendent Dennis Laumeyer credits Ag2School for his communities support for the bond question in August.
“There is no way the Benson School bond would have passed without that tax relief in place,” he said. “Because of Ag2School, Benson Schools will be able to replace 90-year-old buildings with learning spaces that meet 21st century learning.”
Equal Opportunity for Students
The inescapable conclusion is that rural students depend on state aid. Equitable tax policy that takes into account the household income gap for both for school bond payments and for operating referendum revenue is needed. View the Issue Brief
……………………………………………………
For this analysis, rural districts are defined as all Greater Minnesota districts < 7,500 APU. Metro districts are those within the 7-county metro and the Duluth, Elk River, Mankato, Rochester and St. Cloud school districts. Data source for household income: U.S. Census Bureau; American Community Survey, 2017 ACS 5-Year Estimates, Table S1903; generated by Phil Jensen (February 2019)