
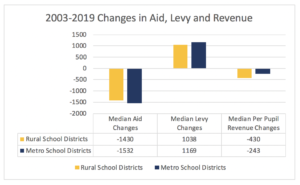
Both rural and metro school districts in Minnesota have lost buying power with state aid since 2003. Metro districts have been able to make more of the loss with levy increases than rural school districts.
MREA looked at the effects of the loss of state aid highlighted in the North Star Policy Institute’s 2018 report Minnesota Backslide: School Aid Cuts on the Horizon. MREA compared rural school districts (all non-seven county metro districts under 7,500 students) to metro school districts (all seven county metro districts plus Greater Minnesota districts over 7,500 students). View rural-metro districts.
While the median metro school district lost more state aid in total over the past 16 years (2003-2019) than the median rural district, metro districts made up the difference in increased local levy revenue and the median metro district’s total revenue buying power was nearly $200 more than the median rural school district. This illustrates challenges in state funding for schools across Minnesota.
 Both rural and metro school districts have had to look to local taxpayers to help fill gaps.
The analysis revealed that metro school districts have a greater ability to raise revenue through local levies than rural districts as a whole.
Learn more about the funding trends.
Will This Continue?
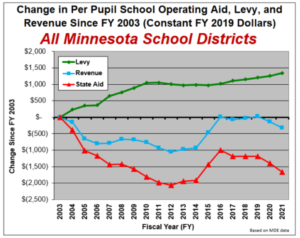
The North Star report extends this analysis to the next biennium, 2020 and 2021. Since school aid increases are not built into the state’s budget, but level funding is (“zero and zero”), inflation will continue to eat at state-aid buying power for all districts.
Maintaining current funding on the state aid formula will result in a $470 decrease in buying power for the median rural district and a $410 drop for the median metro district.
One part of state aid that is not “zero and zero” is special education. Metro districts receive a higher proportion of SPED aid than do rural districts. Learn more about the Special Education Cross Subsidy.
View full report and supporting documents. You may extract charts for your district from this report to share with your community. If you have questions or need assistance, contact. info@mreavoice.org.
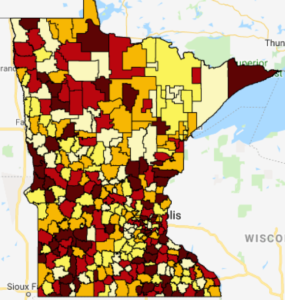
Mapping the Trends
MREA released a series of maps today showing the funding trends by school district in Minnesota.
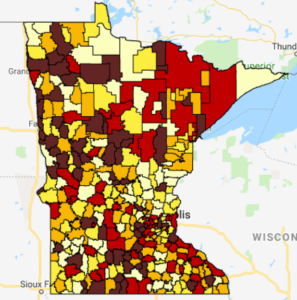
Loss in State Aid Buying Power
District by District Losses from 2003-2019
In Minnesota, state aid for 309 school districts did not keep up with inflation.
View interactive map to see the impact on your school district.
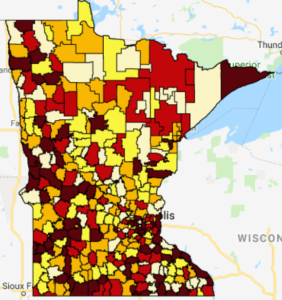 Change in Local Levy Buying Power
District by District Losses from 2003-2019
In Minnesota, 325 school districts saw an increase in buying power from 2003-2019, meaning their local levy rose faster than inflation.
View interactive map to see the impact on your school district.
General Fund Revenue Net
District by District Net of All Sources from 2003-2019
Half of Minnesota’s school districts experienced a net loss of General Fund buying power from 2003-2019 and half experienced an increase. The median was Parker’s Prairie with a $17 increase.
View interactive map to see the impact on your school district.
