
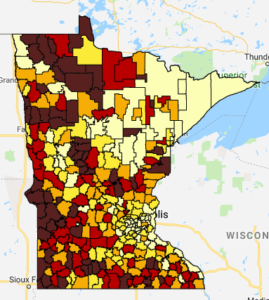
MREA released a map today showing the increasing rural-metro disparity in local Referendum Market Value (property wealth1) per pupil to support operating referendums. The gap between the wealthier and poor districts has grown dramatically in the past four years.
 Key Findings:
- The 5th to 95th gap in operating referendum wealth per pupil has grown 38 percent since 2014 and is now $696,882 per pupil.
- The ratio for the 5th to 95th district in wealth has grown from 3.5 to 4.1.
- The average wealth per pupil for operating revenue is $583,580 in Pay ’18, FY ’19.
- 78 percent of Minnesota school districts (258) have less wealth per pupil. The median school district is $408,286 (Byron).
- 63 percent of metro school districts have wealth per pupil above the average.
- 71 percent of rural districts fall below the average in operating referendum wealth per pupil.
View the interactive map to see your school district and how it compares to others.
Equalization Changes in Minnesota
Minnesota has three tiers of equalization. They cover significantly fewer districts in 2018 in Tiers 2 and 3 than in 2014 when the three tiers went into effect:
- Tier 1 covers 322 school districts (94%) having less than $880,000 RMV/RPU, down from 97%
- Tier 2 covers 229 districts (69%) having less than $510,000 RMV/RPU, down from 81%
- Tier 3 covers 43 districts (13%) having less than $290,000 RMV/RPU, down from 30%
Measures of Wealth & Revenue
This pattern of a rural-metro divide extends to household income and referendum revenue as well as shown by the chart below:
| Rural Household Income, Property Value and Operating Referendum Lag Metro in all Three Measures of Wealth and Revenue | |||
| Household Income (2012) | Referendum Property value per Pupil (’18-’19) | Referendum Revenue above Basic Formula (’18-’19) | |
| State-wide | $58,906 | $583,835 | $1,371 |
| Metro 7 county | $71,921 | $667,210 | $1,638 |
| Rural | $50,462 | $441,224 | $955 |
| Metro/Rural $’s difference | ($21,459) | ($225,986) | ($683) |
| Metro/Rural difference as percentage of Rural base | 43% | 51% | 72% |
Learn more on Household Income by school district.
Learn more about Referendum and LOR Revenue by school district.
How Equalization Works
The taxpayer effort for school district operating referendum revenue in Minnesota is equalized for school districts lower than state set equalizing factors. State aid makes districts below that factor as wealthy if they had that wealth per student. This makes the taxes the same for homes of the same value in different communities. This equalizes the ability of tax payers to support a similar set of education opportunities for the children of their community as other communities across the state.
The Minnesota Department of Education reported that school levy equalization is needed to reduce wealth-related disparities in educational opportunity and tax burdens among school districts given:
- The constitutional requirement for the state to provide a general and uniform, thorough and efficiency system of public schools
- The state’s reliance on local property taxes to fund E-12 education
- The large disparities in property tax base among school districts
(MINNESOTA SCHOOL DISTRICT LEVY EQUALIZATION, Purpose, History and Mechanics, Minnesota Department of Education, Feb. 27, 2013)
Currently three Tiers affect the district operating referendum revenue per Adjusted Pupil Unit (APU)* as follows:
- Tier 1: $0-$300 per APU3 regardless whether voter approved or board approved
- Tier 2: $301-$760 per APU of voter approved operating referendums
- Tier 3: $761-$1,5784 per APU of voter approved operating referendums
Local Optional Revenue (LOR) of $424 per APU is equalized at Tier 2. LOR is General Education Revenue and not Referendum Operating Revenue. Through board action and voter approval only 69 percent of Minnesota’s school districts can generate up to $1,184 per APU above the General Education Formula with equalizing state aid.
Equalization of tax effort is a long standing advocacy position of MREA.
Thanks to MDE for providing the data for this analysis.
……………………………………………………………………………………..
Definitions
1 Wealth is defined as the district’s Referendum Market Value divided by the Resident Pupil Units (RMV/RPU).
2Metro school districts are those with district offices in the seven county metro counties and Greater MN school districts with over 7,500 students: Elk River, Duluth, Mankato, Rochester and St. Cloud
3Adjusted Pupil Units (APU) are the weighted student units which a school district educates. Operating referendum and LOR revenue is determined by multiplying APU by the total LOR and Operating Referendum amount.
4Tier 3 is equalized to an amount equal to 25% of the General Education Formula. For FY ’19 that calculates to $1,578. District eligible for Sparsity Revenue which are also eligible for Tier 3 equalization, receive equalization for the full amount of their voter approved operating referendum
