
Minnesota Gov. Mark Dayton’s $126 per pupil one-time-funding proposal highlights the fragility of school district finances in the state. Examples profiled in a recent MinnPost article include:
- Ogilvie getting community donations for a bus lease payment
- Rockford selling the site for a possible new school
- Triton not filling teaching, administrative, and coaching positions.
In a recent survey of MREA members, 55 percent of the schools districts were making budget reductions or reducing fund balance in 2018-19.
It is not an issue thats limited to Greater Minnesota. Twenty-six metropolitan districts face budget deficits and plan to make budget reductions as well, 68 percent of the Association of Metropolitan School Districts (AMSD) members responding to a similar survey.
Formula Lags Inflation
The causes of this shortfall are clear and have been building ever since the state took over the general formula in 2003 and eliminated the equalized, general state-wide levy that had been the “Minnesota Miracle” since the 1970s.
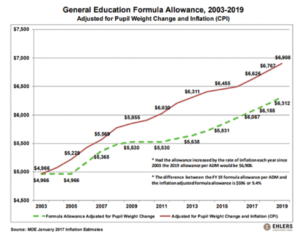 The formula per student has not kept up with inflation since 2003. It is now underfunded nearly $600 per pupil, totaling $525 million annually. As a result, by 2015 Minnesota had fallen to 17th in per pupil funding in the nation. That puts Minnesota’s teacher median salary $1,600 below the national median in 2016.
In the same time period, the Special Education Cross Subsidy has nearly doubled. For Greater Minnesota school districts it is $835 per pupil and $1,064 per pupil for metropolitan districts. Learn more
Gap in Local Operating Revenue
In addition, rural districts face a gap of $683 per pupil in local operating revenue with metro schools. This is 72 percent of the rural local revenue per pupil. To put this in perspective, this gap is 11 percent of the formula.
This results from significantly lower household income to pay the local taxes and lower property wealth per pupil which puts more tax burden on the average home owner. On both of these measures, rural Minnesota lags significantly behind the metro area. The gap in household income ($21,459) is 43 percent of the rural household income. The gap in property value per pupil ($225,986) is 51 percent of the rural value.
| Rural Household Income, Property Value and Operating Referendum Revenue Lag Metro in all Three Measures of Wealth and Revenue | |||
| Household Income (2012) | Referendum Property value per Pupil (’18-’19) | Referendum Revenue above Basic Formula (’18-’19) | |
| Statewide | $58,906 | $583,835 | $1,371 |
| 7-County Metro | $71,921 | $667,210 | $1,638 |
| Rural | $50,462 | $441,224 | $955 |
| Metro/Rural $’s difference | ($21,459) | ($225,986) | ($683) |
| Metro/Rural difference as percentage of Rural base | 43% | 51% | 72% |
(Lower household incomes) x (Lower property values) = Lower local property tax revenue for rural schools
Regardless how the 2018 Legislature and Gov. Dayton end this session regarding funding for schools, MREA commends Gov. Dayton for consistently addressing funding for children’s education. Despite his efforts, how to fund schools sufficiently will be a salient issue for the next governor and 2019 Legislature.