
Both the Minnesota House and Senate currently are considering changes in tax rates on operating referendums for school districts. While property taxes are paid on property value, a MREA analysis released today found a strong relationship between property values to the median income and the impact of the two current legislative proposals.
Tax rates for operating referendums in Minnesota are the relationship between the total levy for operating revenue and the total Referendum Market Value (RMV) of a school district. The current distribution of tax rates reveal a distinct L pattern with many rural school districts with lower median incomes having much higher tax rates than any metro district, as shown by this chart.

MREA analyzed the percent of RMV attributable to households in all 331 Minnesota school districts in relation to the median incomes of those communities and revealed three key findings:
-
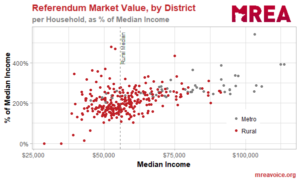
Rural incomes are lower and more clustered than metro incomes.
- Metro household RMV’s are consistently more than 200% of median incomes.
- Rural household RMV values cluster below or very close to 200% with outliers.
A Gap
A previous MREA analysis found a $23,422 rural-metro gap in median household income by school district and a $683 per pupil gap in revenue. In this analysis, MREA examined the relationship between median income, this L pattern of tax rates, and the effects on this L pattern by Operating Referendum Rate Reductions proposed at the Capitol. Both the Minnesota House and Senate include Operating Referendum Revenue Tax Rate reductions in their omnibus bills moving forward to conference committee. Learn more on the proposals and view the impact by district.
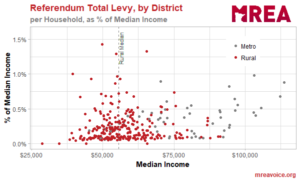
This same median income analysis when applied to the levy payment — the actual dollars paid by household for the Operating Referendum revenue — shows that:
- 210 districts’ tax rates are less than 0.25% of median income (67% of all districts)
- Metro districts with the lowest median incomes look very much like rural districts
- Metro districts with higher median incomes also expend higher percentages of their income on operating levies. There is an “to the right and up” pattern in metro districts.
- As a result of this metro pattern, the median metro household contribution to operating levies as a percent of median income is 0.36% vs. the rural households 0.15% which is statistically significant at p<.001.
- There is no pattern in rural districts between median income and higher operating levies as a percent of median income.
 This underling median income analysis goes a long way to explaining the $683 difference in median rural and metro operating referendum revenue.
The willingness of higher income metro households to expend a higher percentage of their income on operating levies is somewhat masked by the relationship of median income to median household RMV. Because RMV per household is consistently 200 percent or more higher than median income, the tax rates form the bottom right of the L at less than 0.25 percent.
What does this mean?
If as a state, we are serious about providing equal opportunity regardless of zip code, then this L pattern of tax rates must be addressed. To have higher tax rates in communities with lower median incomes is both inequitable for tax payers in those districts with higher tax rates and for students in similar low RMV, low median income districts whose voters have chosen not tax themselves at a higher rate.
Which proposal, HF 2400 or SF 5 affects this L pattern the most?
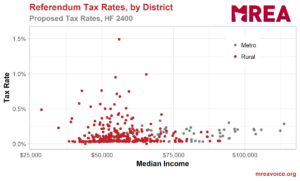
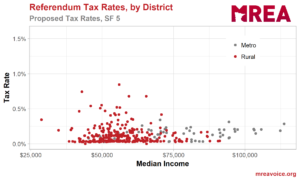
The analysis found that SF 5 would have the greatest positive impact. By increasing the Third Tier Equalizing Factor from $290,000 RMV/RPU to $440,000 along with smaller increases in the Tier 1 and 2 Equalizing Factors, SF 5 is a start to making this tax rate chart relatively flat while allowing school districts to generate equal dollars per student for equal tax rates regardless of their property value or median incomes. Learn more on the two proposals.