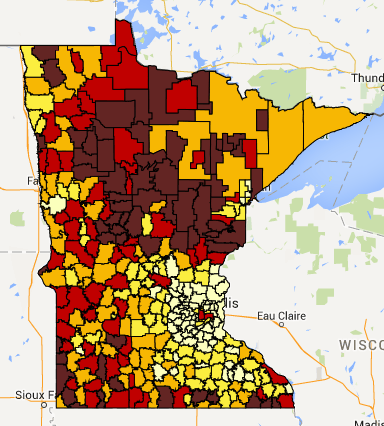
MREA released a map today illustrating median household income by school district in Minnesota. The map reveals a wide rural-metro divide with the state’s wealthiest district’s median income more than five times the amount of the poorest district. Nine of the 12 districts with the lowest median household income in Minnesota serve a significant number of American Indian children. The map A thumbnail of the map is below. View the interactive map.
Key Facts
- Wide Range: The range in household income is enormous from Minnetonka at $105,594 to Pine Point at $21,458.
- Rural-Metro: School districts within the seven county metro area average $71,921 in median income compared to $50,462 in Greater Minnesota. A 42.5 percent difference. (This has been reported previously on a county basis in 2014 (State of Rural Minnesota Report, Center for Rural Policy and Development)
- American Indian Children: Nine of the 12 districts with the lowest median household income serve a significant number of American Indian children, ranging from 35 percent to 100 percent of their student body.
Key Questions
- How does Minnesota provide equal educational opportunity statewide when the number one predictor of academic achievement and educational attainment is household income? (Family Income and Educational Attainment 1970-2009)
- If household income is a measure of “ability to pay” for goods and services of all kinds, including taxes for public services such as education, how does household income relate to Minnesota’s school tax bases and the equalization of tax effort for facilities and programming?
- How can Minnesota improve educational outcomes for students for whom poverty and non-majority cultural status combine into great educational gaps such as for American Indian Students who have the lowest graduation rate and largest gap of all Minnesota’s sub-groups. Read more.
Background:
The median household incomes for Minnesota school districts comes from the U.S. Census Bureau’s American Community Survey (ACS). The ACS is captured from surveys mailed to 3.5 million housing unit addresses annually.
The map illustrates data from 2007-2012. Because the number of households surveyed, even over five years, in a school district is likely to be small, the average margin of error for this data is 8.4 percent. There is a 95 percent confidence the true median income of any single district is within 8.4 percent up and down from the number posted.
This map displays median household income, meaning half of the households earn more and half earn less. It is not the average household income.
[…] Learn more about median household income in your district. […]