
How does the educational opportunity in your community stack up against the nation? A new study by the Center for Educational Policy and Analysis at Stanford University digs into data to evaluate academic proficiency and growth in 3rd and 8th grade.
Using test scores from 45 million students in over 11,000 school districts, researcher Sean Reardon analyzed student performance on state accountability tests for 3rd graders from 2009 and 2010 compared to when they’d be 8th graders in 2014 and 2015 to measure growth over time. He scaled the state tests to the NAEP to create in inter-state scale. He combined schools, including charters, located within a county into county scores which he classified as rural or metro counties.
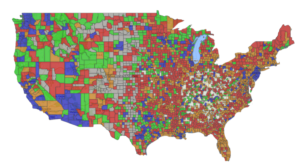 The resulting national county-by-county map, pictured to the right, shows a mosaic of achievement and growth. In general, Minnesota counties showed higher than average achievement in both grades three and eight, but fewer showed greater than five years growth from grades 3-8. See how your district performs by visiting this page and scrolling to bottom to search.
Red counties are rural where students gained less than five grade levels; green counties are rural where students gained five or more years between third and eighth grades. Orange counties are metro areas with gains under five years; blue are metro counties with gains of five years or more. Gray counties had insufficient data.
While children should advance five grade levels on standardized tests over five years, Reardon found that’s not alway the case. Children in some school districts fall behind; others gain more than five grade levels.
Reardon describes it this way, “I argue that third grade average test scores can be thought of as measures of the average extent of educational opportunities available to students in a community prior to age 9. Growth rates in average scores from grade 3 to 8 can be thought of as reflecting educational opportunities available to children in a school district between the ages of 9 and 14.”
To find your specific school district and compare with a selection of other Minnesota school districts, type your district’s name into this NY Times search function. You will need to scroll to the bottom of the page to search.
To learn how you can improve your districts’ education opportunities, save the date for MREA’s Annual Conference Nov 11-13, Engaging Minds, which will focus on academic learning in grades 3-9.