Local Operating Revenue (LOR) and voter approved operating referendum revenue have become increasingly necessary and important to provide funding for students, beyond the basic formula, in Minnesota. MREA looked into the data to evaluate the funding’s impact, in light of the Minnesota Legislature’s 2019 changes.
In the case of both operating referendums and LOR, the analysis found that rural districts are at disadvantages compared to metro districts:
- LOR, now at $724 per pupil, provides a needed additional 11 percent to the 2020 formula for all school districts, but only generates on average 34 percent higher tax rates for rural residents and businesses due to lower property values, even with the current equalization factors.
- Metro districts voters have approved operating referendums that generate on average four times the revenue per pupil as in rural districts: $1,063 for metro students compared with $269 for rural students on average.
Local Operating Revenue (LOR)
The 2019 Legislature separated Local Optional Revenue (LOR), which the school board can access directly up to $724 per pupil served (APU), from voter approved Operating Referendum Revenue.
Eleven rural districts now have allowances ranging from $16 to $464 greater than they previous accessed. School boards may under levy LOR as with all other levies.
The equalization factor for this $724 have not changed:
- The first $300 is equalized at $800,000 per Resident Pupil Unit (RPU)
- The next $460 is equalized at $510,000 per Resident Pupil Unit (RPU)
A complication of the state share of LOR for each district is that the equalizing factors are based on Resident Pupil Units (RPU), while the allowance—the revenue that can be raised—is based on student served Adjusted Pupil Units (APU). Districts with large net open enrollment-in will have tax rates higher than expected and districts with net open enrollment-out will have lower than expected tax rates.
Another complication is the effect of Tax Base Replacement aid for rural districts that had greater than $415 per pupil in voter approved operating referendum as of FY 2002, when Class 2 Ag Land was removed from the tax base for operating referendums as part of the “Big Plan.” The Minnesota Department of Education (MDE) will reduce a districts LOR or first tier Operating Referendum to make the Tax Base Replacement Aid revenue neutral from FY ’20 to FY ’21. However, they do not have this modeled yet. Therefore for districts with Tax Base Replacement aid, this MREA analysis overestimates Pay ’20 taxes and tax effort.
For an equal $724 per pupil, rural residents pay a 34 percent higher tax burden in higher average tax rates.
This is despite the 30 percent state share of the LOR. This is due to the overwhelming metro advantage in property wealth in Referendum Market Value (RMV). Learn more
| Referendum Market Value (RMV) | Pupils Served (APU) | LOR Allowance $724 per APU | % State Share of LOR | % Local Share of Tax Burden | Tax Rate on RMV | |
| Statewide | 566,927,259,545 | 881,111 | 637,924,574 | 17.5% | 82.5% | 0.093% |
| Metro | 413,933,991,933 | 536,420 | 388,368,428 | 9.4% | 90.6% | 0.085% |
| Rural | 152,993,267,612 | 344,691 | 249,556,146 | 30.1% | 69.9% | 0.114% |
*Rural districts are defined as those with <7,500 APU outside the Seven County Metro Area. This defines Duluth, Elk River, Mankato, Rochester and St. Cloud as metro districts.
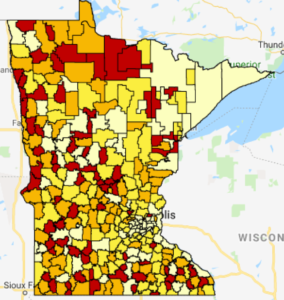 What’s the tax impact of the new LOR $724 on $150,000 home?
School districts highlighted in red in the interactive map experience the highest LOR tax impact. Those identified in orange also fall above the median in the state.
The yellow districts fall below the median LOR tax impact with those highlighted in the lightest color being impacted the least.
Operating Referendums
With the transfer of the $300 board approved referendum revenue (LOR), all operating referendums were reduced an equal $300 by the 2019 Legislature. The first $460 of the remaining voter approved referendum revenue equalization factor was increased to $567,000 per Resident Pupil Unit (RPU) by the 2019 legislature. This is an increase of $57,000 from $510,000. Learn more
The second tier of equalized revenue, up to $1,609, which is 25 percent of the formula, was unchanged at $290,000 per RPU. The estimated referendum cap is $2,012 per APU. For districts qualifying for sparsity revenue there is no cap as they are necessarily districts with fewer than 400 students in high school or fewer than 20 students per elementary grade and meet the requirements for distance from the next nearest elementary or high school.
The Rural-Metro* analysis shows that:
The strong majority of the voter approved operating referendum revenue in the state (86 percent) goes to metro school districts.
- This exceeds by 25 percent their 61 percent percentage of Minnesota’s students.
- Only 14 percent of the revenue goes to rural schools, which educate 39 percent of the state’s students.
There are two rural-metro factors contributing to this difference:
- Property Wealth: The metro as a whole has 2.7 times the operating referendum market value as rural Minnesota which lowers the relative tax rates for generating comparable revenue. Learn more
- Household Income: The average metro median household income exceeds the average rural household income by $23,422. Only 4 percent of rural districts are wealthier per household than half of the metro districts. Learn more.
7-County Metro: $79,058
Rural: $55,636
| FY ’20 OperatingReferendum per APU |
Total APUs | % of APU | FY ’20 Operating Referendum Revenue | % of Operating Referendum Revenue |
|
| Statewide | 753 | 881,111 | 663,062,216 | ||
| Metro | 1,063 | 536,420 | 61% | 570,354,407 | 86% |
| Rural | 269 | 344,691 | 39% | 92,707,809 | 14% |
*Rural districts are defined as those with <7,500 APU outside the Seven County Metro Area. This defines Duluth, Elk River, Mankato, Rochester and St. Cloud as metro districts.
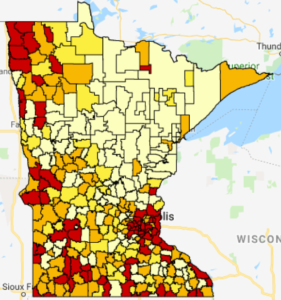
Operating Referendum Revenue By Pupils Served
There are 111 school districts in the state, all rural, that have zero voter approved operating referendum revenue. Those districts are highlighted in the lightest color in this new map produced by MREA with the latest state data.
The school districts highlighted in red receive the largest operating referendum revenue in the state.
This map of per pupil voter approved operating referendum revenue clearly shows a pattern of higher per pupil amounts in the metro school districts and sparse rural school districts with smaller number of students.