MREA released maps today showing the wide range of aid, levy and revenue increases and decreases for Minnesota school districts since 2003. Differences in voter approved levies have resulted in a wide variation in revenue in districts in the state.
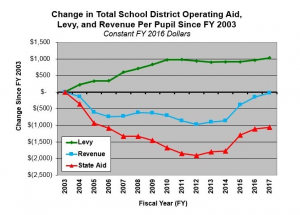 State aid of all types, including the General Education Formula, have declined 10 percent or $1,016 per pupil between 2003 and 2017 in constant 2016 dollars when adjusted for inflation.
This decline in aid has been masked on average with an average increase of $1,031 per pupil in levy revenue over the same time period. The result on average is essentially flat total revenue per pupil for schools districts in Minnesota.
Jeff Van Wychen of the North Star Policy Institute provided the original analysis using data from the Minnesota Department of Education (MDE).
Wide District Effects
While the General Education Formula fell 10 percent when adjusted for inflation, the effects per district for all state aid vary widely. This is because aid is included with funding streams that are based on the type of students districts’ serve, choices districts make on program participation, and degree of equalization in some funding streams.
 Student counts impact state aid per district year-to-year for special education, Compensatory, LEP and AMI aid among others. Districts make choices whether to enter the QComp program or Integration Districts. Aid for Long Term Facility Maintenance and Operating Capital vary by property wealth per student.
Per Pupil Aid Changes
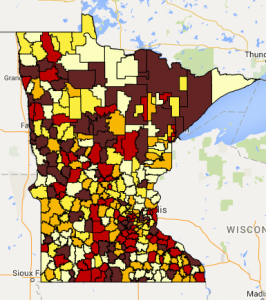
These variables create a $3,000 range in changes of aid per district (excluding the 5 percent greatest decreases and increases). Districts experiencing significant decreases in state aid can be seen across the state since 2003, as shown in the darkest color in the map to the right.
View the interactive map of state aid change by school district
General Fund Revenue
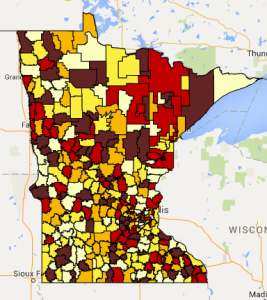
A similar range of $3,000 is found in total general fund revenue per student (excluding the 5 percent greatest decreases and increases), as shown in the map to the right.
View the interactive map of revenue by school district
Districts that were above the average increase of $30 in total revenue per pupil from 2003 to 2017 increased their levies, both voter approved and nonvoter approved, by an average of $1,397.
This represents twice the average of the districts that fell behind in total revenue adjusted for inflation. These districts for the most part increased their levies per pupil but only by an average of $676 per pupil.
Driven by Operating Levies
When MREA examined the variation in operating levies, including board approved and LOR, compared to overall levy changes, it found a strong relationship.
- Districts in the bottom half of levy increases have an operating levy average of $883. This is not much more than the $724 total of board approved and LOR operating levies.
- Districts in the top half of levy increases have an operating levy average of $1,302.
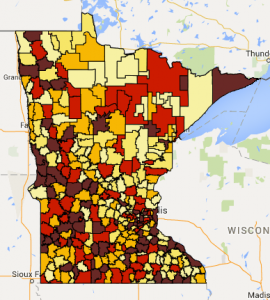 This relationship intensifies when the bottom 25 percent is compared to the top 25 percent in levy increases. The result is a $2,000 range in the increases in levies (excluding the 5 percent largest decreases and increases), as show on the map to the right.
View the interactive map by school district
Full Report, Your District Data
Statewide, these trends are clearly visible in this chart from a recently released, detailed report on statewide and individual district funding by the North Star Policy Institute. View the Report Summary.
Individual reports for a school district are available from MREA. Members may complete this form to request data for their respective school district.