
In past legislative sessions, MREA has noticed many rural legislators are hesitant to put money into the Basic Formula Allowance because they think the funding streams tied to the Basic Formula favor Twin Cites metro-area schools. In reality, adding money on the formula helps all schools, and different funding streams affect metro and Greater Minnesota schools differently.
Four Funding Streams Tied to Basic Formula
- Declining Enrollment Revenue
- Compensatory Revenue
- Transportation Sparsity Revenue
- Sparsity Revenue
Part IV: Sparsity Revenue
MREA published Part I of this series, exploring how Declining Enrollment Revenue is impacted by the Basic Formula Allowance. Part II of the series discussed Compensatory Revenue, and Part III explored Transportation Sparsity Revenue.
Sparsity Revenue, which is different than Transportation Sparsity Revenue, is another funding source linked to the Basic Formula Allowance. Today, MREA explores the purpose of this funding source and breaks down how it affects each individual Minnesota district.
Sparsity Revenue is another funding source linked to the Basic Formula Allowance. Today, MREA explores this funding source and breaks down how it affects each individual district.
Purpose
According to MN House Research, the purpose of Sparsity Revenue is to provide additional revenue to geographically large districts that have relatively few secondary pupils. This revenue acknowledges the higher cost of smaller education programs, where options to increase the number of students in a school would require students to travel an unacceptable amount of time.
There are two parts to the sparsity formula – one for secondary schools and one for elementary schools. The secondary school sparsity formula takes into account a secondary school’s enrollment, distance from the secondary school to the nearest secondary school, and the geographic area of the secondary school attendance area. The elementary sparsity formula provides additional funding for elementary schools that average 20 or fewer pupils per grade and that are 19 miles or more from the next nearest elementary school.
Calculations and Allocations
Definitions and calculations for Sparsity Revenue can be found in Sec. 126C.10 MN Statutes Subd 7 & 8.
Secondary Sparsity Revenue
The formula measures sparsity and isolation of the district and then provides additional revenue to the district using an assumption about how many pupil units are necessary to run an acceptable secondary program. The formula for secondary sparsity revenue assumes that a district with 400 secondary pupils in average daily attendance can provide an acceptable secondary program. Therefore, a district with one high school, no matter how few pupils per square mile it has, will not receive any sparsity aid if the district has a secondary average daily membership (SADM) in excess of 400. In addition, the requirement of large geographic size ensures funding for districts that have few pupils due to geographic isolation and not due to a school board’s reluctance to provide cooperative programming with a neighboring schoo district.
To be eligible for secondary sparsity revenue, a high school must meet two requirements:
-
- an isolation index greater than 23, and
- fewer than 400 pupils in average daily membership.
Minnesota House Research Department lays out Sparsity formula as follows:

Sparsity Formula allowance = Basic Formula Allowance – $530
Secondary Sparsity Revenue =
Formula Allowance x Adjusted Pupil Units x (400 – SADM)/(400 + SADM) x (Isolation index – 23)/10
Hypothetical Example – Gopherville School District
Adjusted Pupil Units = 700
Secondary Average Daily Membership (ADM) = 300
General Education Formula Allowance for Sparsity = $6,333 (calculation: $6,863 – $530)
High School Attendance Area = 356 Square Miles
Distance from High School to Nearest High School = 22 Miles
Secondary Sparsity Revenue
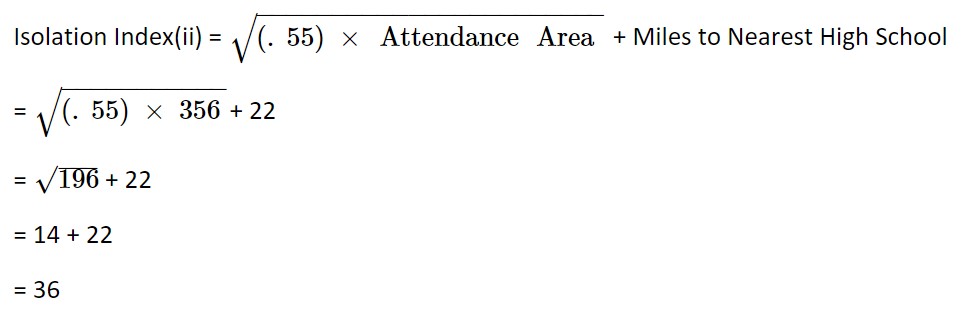
= Formula Allowance × Sec. ADM × (400−Sec ADM)/(400+Sec ADM)× the lesser of (a) 1.5 or (b)( ii−23)/10
= $6,333 × 300 ×(400−300)/400+300× the lesser of (a) 1.5 or (b) (36−23)/10
= $6,333 × 300 × (100/700) × the lesser of (a) 1.5 or (b) (13/10)
= $6,333 × 300 × 0.14 × the lesser of (a) 1.5 or (b) 1.3
= $6,333 × 300 × 0.14 × 1.3
= $345,782
Elementary Sparsity Revenue
Elementary Sparsity Revenue. A school district qualifies for elementary sparsity revenue if it has an elementary school that is located 19 or more miles from the next nearest elementary school and has fewer than 20 pupils on average per elementary grade. As with secondary sparsity revenue, the more elementary pupils in average daily membership (EADM) attending the school, the lower the elementary sparsity revenue per pupil.
Elementary Sparsity Revenue Formula

Hypothetical Example – Gopherville School District, ABC Elementary School
Grades K-6 Pupil (ADM) = 100
General Education Formula Allowance for Sparsity = $6,333 (calculation: $6,863 – $530)
Distance to Nearest Elementary School = 23 miles
Elementary Sparsity Revenue
= Elementary ADM × (Formula Allowance x (140−Elem ADM/140 + Elem ADM))
= 100 × ($6,333 × (140−100/140+100))
= 100 × ($6,333 × (40/240))
= 100 × ($6,333 × 0.1667)
= 100 × $1,056
= $105,600
Impact on Minnesota Districts
MREA created a map that shows sparsity revenue for Minnesota districts.
View the MREA Sparsity Revenue Map for FY23
Only 98 districts in Minnesota receive Sparsity Revenue in FY23. Of those districts, the median revenue amount is $343 per pupil for FY23. The map shows that remote areas in northern and western Minnesota receive the majority of the Sparsity Revenue. Grygla School District receives the most Sparsity Revenue per pupil at $4,119. In FY23, it is estimated that Sparsity Revenue will exceed $29 million as a statewide revenue stream.
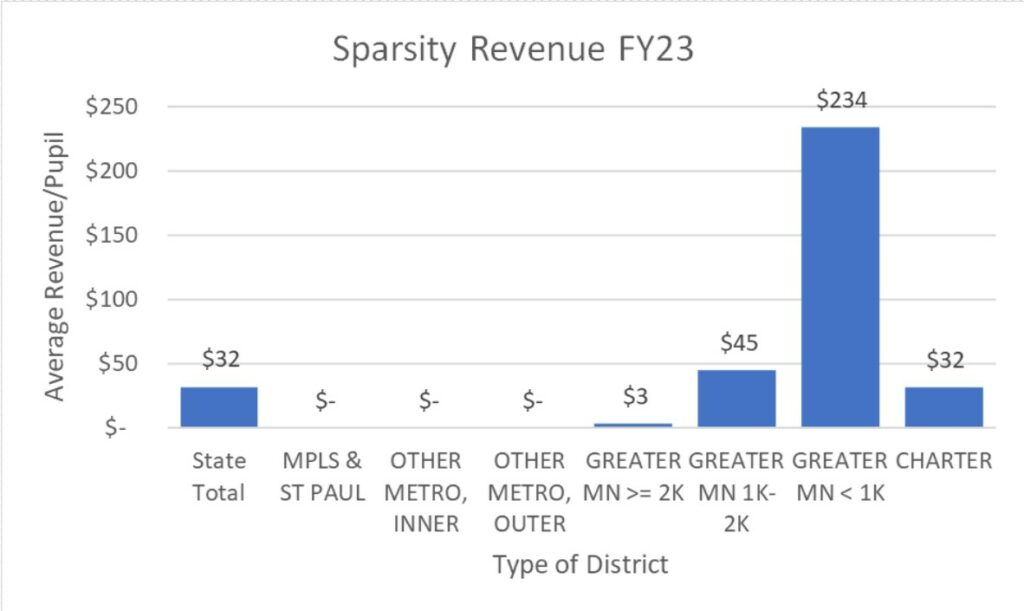
The graph above shows the data in another way. It uses statewide averages that show the distribution of sparsity revenue by type of district. As you may expect, smaller remote districts receive the greatest amount of Sparsity Revenue. Larger metro schools do not receive Sparsity Revenue.
General Facts about Sparsity Revenue
In FY22, the densest district in the state was Brooklyn Center with a population of 835 pupils per square mile. The sparsest district was Grygla with a population of .18 pupils per square mile.
The smallest district geographically is St. Anthony-New Brighton with 2.59 square miles, and the largest is St. Louis County with 4,201 square miles.
A school district that closes a school facility is eligible for at least as much Sparsity Revenue as it received in the previous school year. A district that loses Sparsity Revenue because of a neighboring district’s decision to relocate a school is eligible for at least as much sparsity revenue as it received in the previous school year. A district that certifies that it would not close a school building unless it continues to qualify for Elementary Sparsity Revenue at the previous amount (with the building remaining open) may close a school building and not have its elementary sparsity revenue reduced.
As with Transportation Sparsity, Sparsity Revenue heavily favors rural districts. It is intended for districts with 400 or less students in the secondary school as well as an elementary school with an average of fewer than 20 students per grade.
Sparsity Revenue is a revenue stream that is attached to the Basic Formula Allowance. Consequently, as there are increases in the Basic Formula Allowance, there will also be increases in Sparsity Revenue.
The final article in this series will be published in October. MREA will explore how a one percent increase in the Basic Formula affects each district throughout the state, also factoring in the four revenue streams tied to the Formula Allowance. We’ll find out – is it equitable or not?