
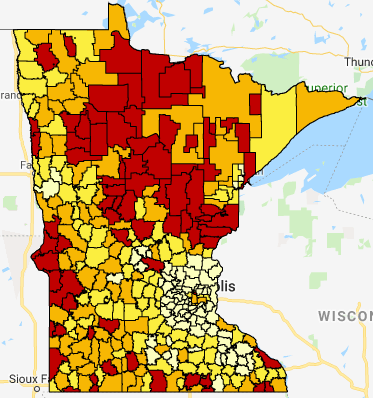
Basic Skills Revenue (Compensatory) is used to meet the educational needs of pupils who are…
How much did each school district receive in ESSER funds? What is the per pupil amount? What can districts spend their funds on? How is the amount determined?
How has school operating revenue changed statewide? What’s the impact of Local Optional Revenue and Board Authorized Referendum Revenue?
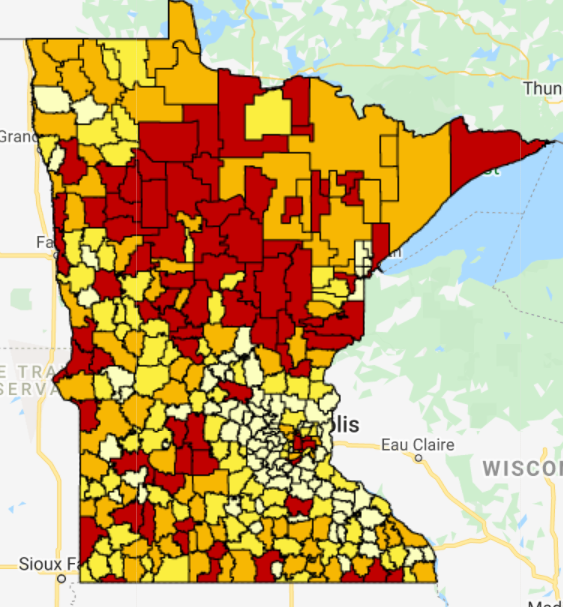
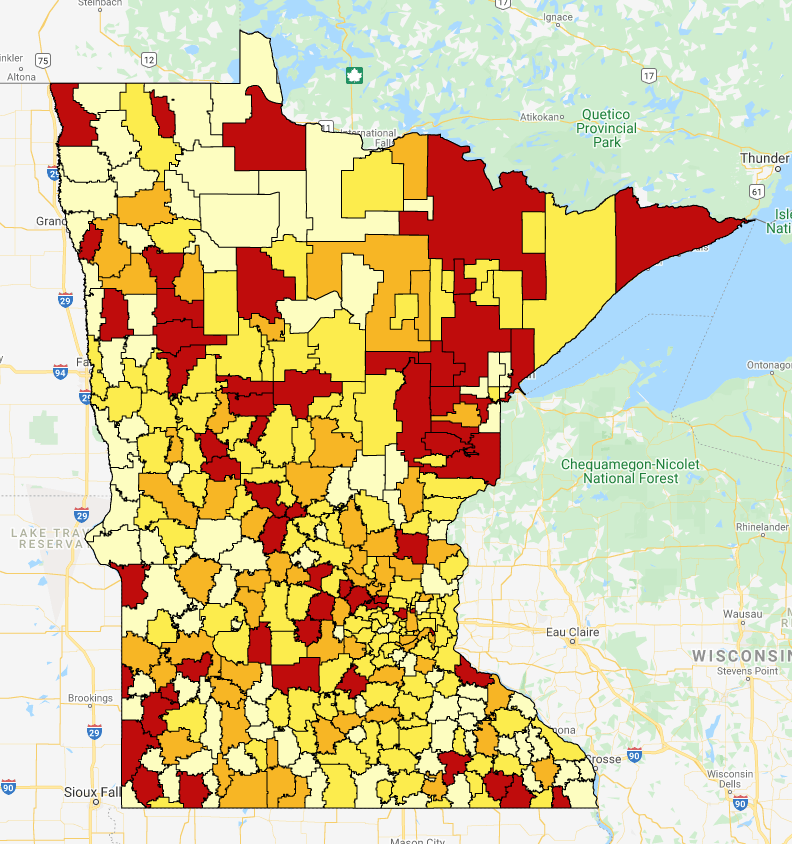
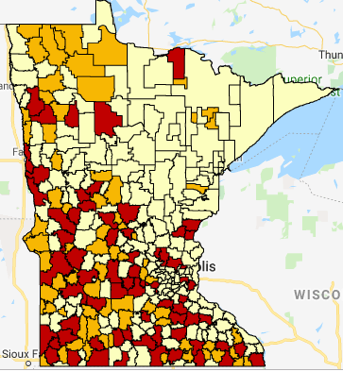
Patterns in Referendum Market Value by Residential Pupil Units as a measure of Minnesota school district property wealth in 2021.
There’s a wide rural-metro divide with the state’s wealthiest district’s median income more than five times the amount of the poorest district.
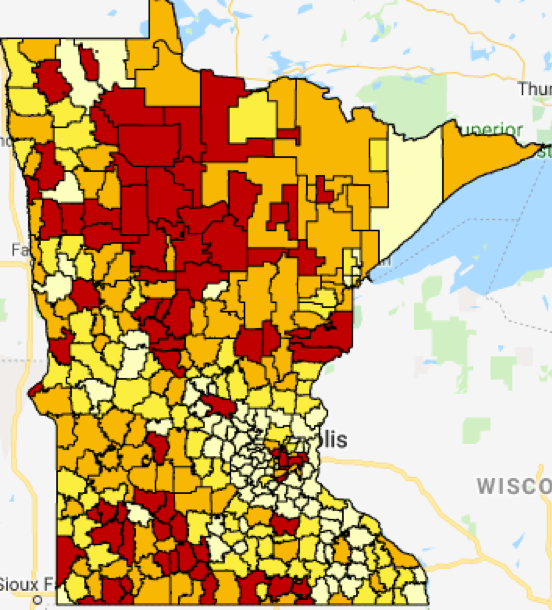
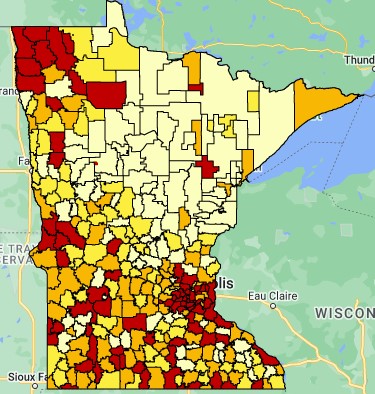
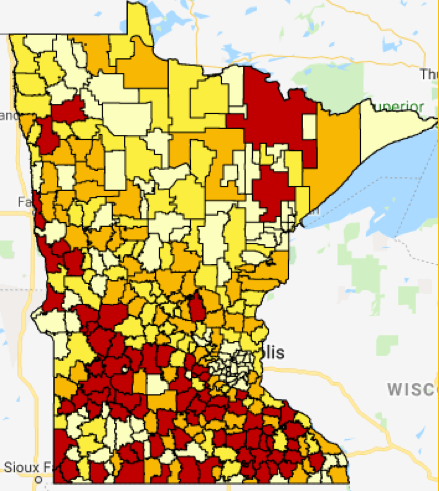
Family income and child poverty in Minnesota’s school districts by means of free and reduced lunch meals. Fifteen Greater Minnesota school districts have FRE percentages of 67 percent or more.
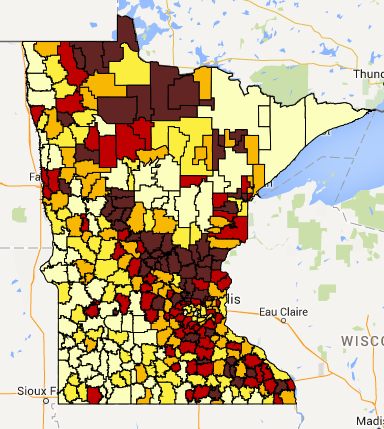
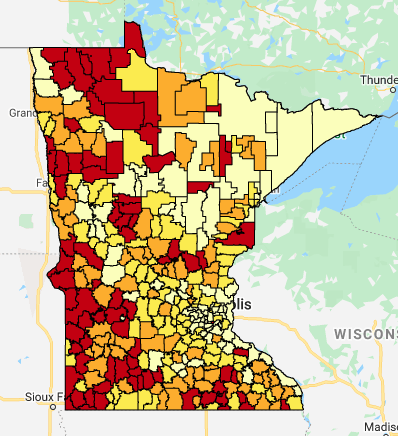
Patterns in ANTC/APU as a measure of Minnesota school district property wealth in 2017.
Basic Skills Revenue (Compensatory) is used to meet the educational needs of pupils who are…

MREA Releases ESSER Funds Map and Answers ESSER Questions The federal government recently announced the…
MREA released a map today showing the impact of the proposed one-time financial relief for…
MREA released a new map today showing the impact of proposed legislation on voter approved…

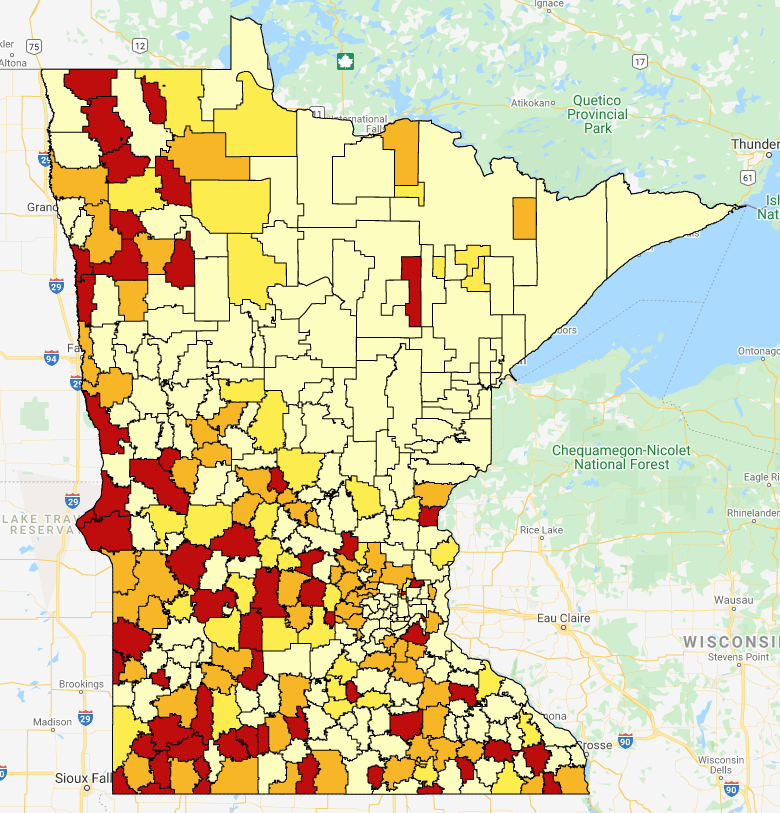
Nearly 31,000 rural public school students live in households that do not have broadband Internet…
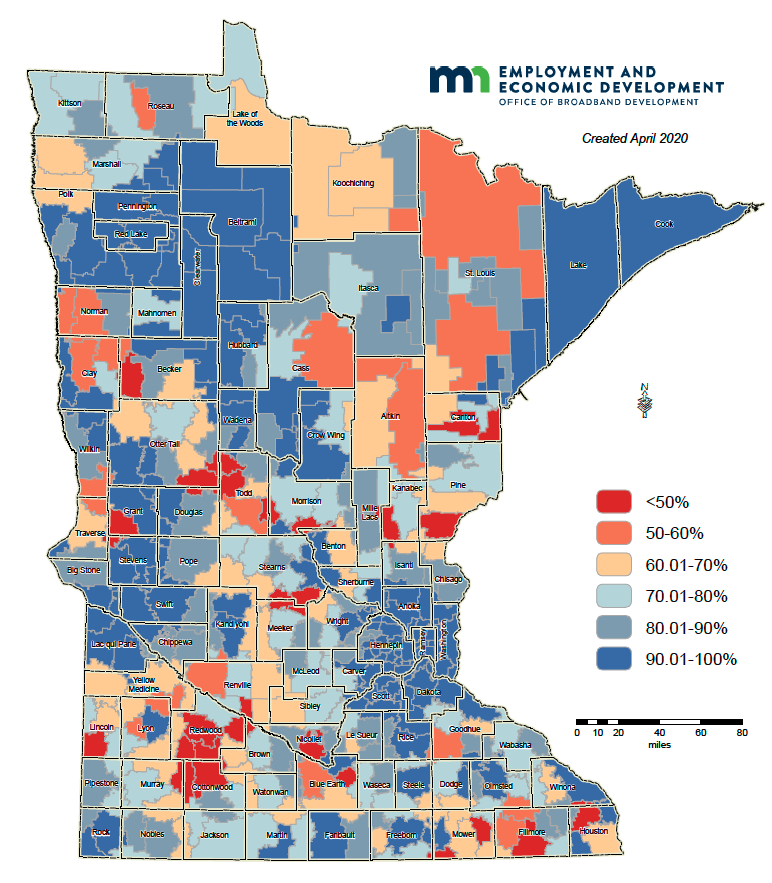
A new map with the latest from Minnesota’s Office of Broadband Development shows rural households…
Bond referendums in rural Minnesota have passed at a higher rate, following the state increasing…
An increase in the First Tier of operating referendum equalization in Minnesota in 2019 will…

A total of 48 school districts in rural Minnesota will go to voters this November…
MREA released three maps of student demographics from the just completed 2018-19 school year that…