
In past legislative sessions, MREA has noticed many rural legislators are hesitant to put money into the Basic Formula Allowance because they think the funding streams tied to the Basic Formula favor Twin Cites metro-area schools. In reality, adding money on the formula helps all schools, and different funding streams affect metro and Greater Minnesota schools differently.
Four Funding Streams Tied to Basic Formula
- Declining Enrollment Revenue
- Compensatory Revenue
- Sparsity Transportation
- Sparsity Revenue
Over the next couple of months, MREA will feature each of the funding streams, why they’re needed, and how each funding stream impacts individual districts. MREA hopes exploring each of the four funding streams will help both education leaders and legislators see how increases in the basic formula allowance affect all districts throughout the state.
For example, although Compensatory Revenue is needed in all schools, Minneapolis and St. Paul area school districts receive more than three times as much in compensatory revenue as rural districts. Conversely, Sparsity Transportation Revenue and Sparsity Revenue most often benefit rural rather than metro districts.
Part 1: Declining Enrollment Revenue
The current formula pays for 28% of a district’s loss of revenue due to declining enrollment, based on the difference in year-to-year APU counts. It does not pay for all revenue lost but does soften the blow by paying for approximately one out of every four students that a district loses. Smaller schools with declining enrollment are put in a tough place when they need to cut sections and still try to retain staff member(s).
During the Covid-19 pandemic, K-12 public school education took a hit with students leaving for multiple reasons. In February 2021, the Minnesota Department of Education showed that home-school enrollment had jumped 50% compared to 2019, public school enrollment fell by 2%, and private school enrollment increased by .7%. In the 2021-22 school year, public schools saw another .3% decrease in student enrollment.
This decreasing enrollment set the stage for Declining Enrollment Aid to become a significant point of discussion for public schools. In 2021, Pandemic Enrollment Loss Support Aid provided over $29M in one-time, additional declining enrollment revenue for districts. In FY22, however, there was no additional relief for those districts that had declining enrollment due to students leaving during the pandemic.
History of Declining Enrollment Aid
Minnesota Department of Education recently published the History of Declining Enrollment Adjustments in Minnesota School Finance, which gives a clear picture of what has been happening with enrollment in Minnesota Public Schools.
Since 1971, Declining Enrollment Aid has been a vital revenue source for rural districts who have declining enrollment. Minnesota Public Schools experienced an uptick in enrollment from 1987 until 2020, when the pandemic changed the landscape. There have been many revisions to the Declining Enrollment Aid legislation since 1971.
In 2013, the legislature passed the current version of legislation, which provides districts with 28 percent of the formula allowance for that year multiplied by the loss in adjusted pupil units from the preceding year.
The graphs in the MDE article are from the fall of 2021 and can be a little deceiving because of the one-time Pandemic Enrollment Loss Support Aid in 2021. For example, Charter Schools show up as receiving the least amount of revenue per pupil in FY21, mainly because they did not have access to the one-time Pandemic Enrollment Loss Support Aid. In past years, charter schools do well with declining enrollment aid.
The graph below shows that in FY23 Charter Schools, Greater Minnesota districts with a student population less than 1,000 pupils, and Metro districts are expected to receive more than the state average of $18 per pupil. Further, Greater MN districts with a population of over 1,000 and outer-ring metro districts are expected to receive less than the state average for Declining Enrollment Aid.
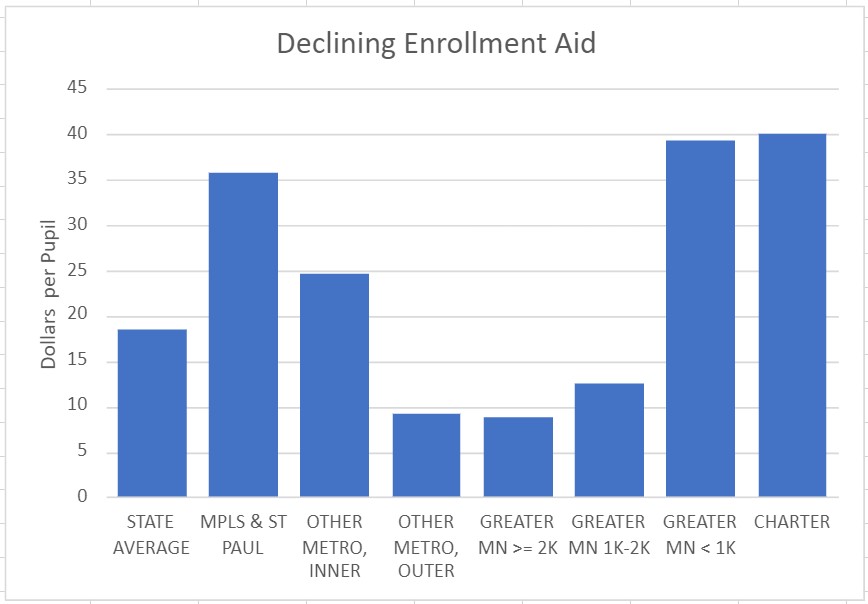
FY23 Declining Enrollment Aid
In the article, projections do predict that the state’s portion of Declining Enrollment Revenue will continue to increase over the next couple of years.
Impact of Declining Enrollment Aid on Minnesota Districts
Since Declining Enrollment Aid is tied to the basic formula allowance, every percentage increase in the basic formula allowance equates in an increase in aid districts receive for Declining Enrollment Revenue.
MREA’s Declining Enrollment Revenue map shows the impact per Pupil across the state. The median amount is $20 per pupil for the districts who will receive Declining Enrollment Revenue in FY23.
View the MREA Declining Enrollment Aid Map
There are 158 Minnesota districts that will not receive Declining Enrollment Aid in FY23, which means they are projected to maintain or grow enrollment. Rural districts account for 38 of the top 40 districts who receive larger Declining Enrollment Revenue per pupil.
Declining Enrollment Aid is not needed in every district. As a matter of fact, close to half the districts in the state will not be receiving Declining Enrollment Aid in FY23. However, for those districts that are experiencing declining enrollment, it remains an important revenue stream that can bring some stability to the loss of revenue experienced when a district loses students. This revenue is directly tied to the general formula in a straight forward formula that multiplies pupils lost by .28. As the formula increases, so does the declining pupil aid.