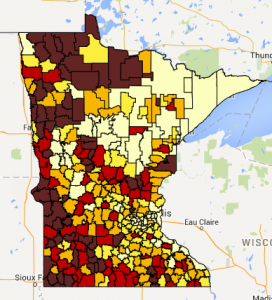
MREA released a map showing patterns in Referendum Market Value by Residential Pupil Units as a measure of Minnesota school district property wealth in 2014. RMV/RPU is currently equalized in three tiers, which are shown in the thumbnail below. View the interactive map.
Key Findings
- RMV/RPU has variation in property wealth across the state, but not as wide a variation as ANTC/APU. The chart below uses the 5th-95thmethodology to analyze dispersion in school district property wealth per pupil. There is 60 percent more variation in ANTC/APU than in RMV/RPU.
| RMV/RPU | ANTC/APU | |
| 5th Percentile in Wealth | 201,089 | 3,271 |
| 95th Percentile in Wealth | 704,871 | 18,239 |
| Ratio of 5th to 95th Property Values/Pupil | 3.5 | 5.6 |
- The RMV/RPU pattern of distribution across the state comes close to matching the distribution of median household income across the state by school district with the striking exception of the Central Lakes Area. Learn more about Household Income and view the interactive map by school district.
Background
In 2001, Minnesota established Referendum Market Value (RMV) by excluding agricultural land and seasonal recreation properties from the tax base for school district operating referendums. School district wealth is calculated by dividing RMV by the Residential Pupil Units (RMV). The distribution of this narrower tax base of residential homes, apartments and commercial property is shown in this:
- Tier 1 <$880,000
Includes 322 districts of 332 Minnesota districts and applies to $0-300 of referendum revenue - Tier 2 <$510,000
Includes covers 269 districts and applies to $301-760 of referendum revenue and Local Optional Revenue (LOR) of up to $424 - Tier 3 <$290,000
Includes 101 districts and applies to $761-1457 of referendum revenue
What’s Next
MREA is releasing a series of maps looking at various aspects of school district wealth and household income. These were released previously in the fall of 2014 and can be found at Determining District Wealth Report: View Part 1. View Part 2.