
Per-pupil state aid to schools has fallen 10 percent and operating levies have increased dramatically over the past 15 years, when adjusted for inflation. The combination has resulted in flat per pupil funding over 15 years when adjusted for inflation.
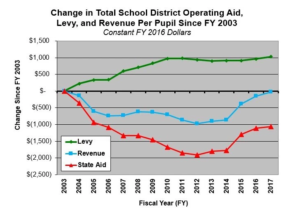 These trends are clearly visible in this chart from a recently released, detailed report on statewide and individual district funding by the North Star Policy Institute.
View the full report including a chart for your school district.
The analysis begins in 2003, because that is when Minnesota abandoned the equalized general education levy of the 1970’s Minnesota Miracle and began full state funding of the basic formula with a dramatic reduction in property taxes statewide.
Increases Offset by Aid Decline
While there have been increases in state funding since 2013, these increases have not offset the preceding steady decline in state aid from 2004-2012. Over that same time, operating property tax levies increased $935 per pupil (essentially doubling), but did not match the loss of $979 in the buying power of the state formula aid.
The report goes on to observe and conclude:
School districts also have additional costs related to an increased concentration of special need students—such as students from immigrant backgrounds with limited English language skills. The special education cross subsidy (i.e., the amount that must be diverted from general education revenue to pay for mandated special education services that are not funded by the state or federal governments) has increased significantly faster than the rate of inflation since FY 2003.
In short, on a statewide basis school districts have additional expenses today that they did not have in 2003, but they do not have additional resources after adjusting for inflation.
MREA thanks the North Star Policy Institute for initiating this study and its author Jeff Van Wychen for its detailed and thorough analysis.
View the full report including a chart for your school district.