
Compensatory Education Revenue
Minnesota’s Funding Rollercoaster Ride 2021-24
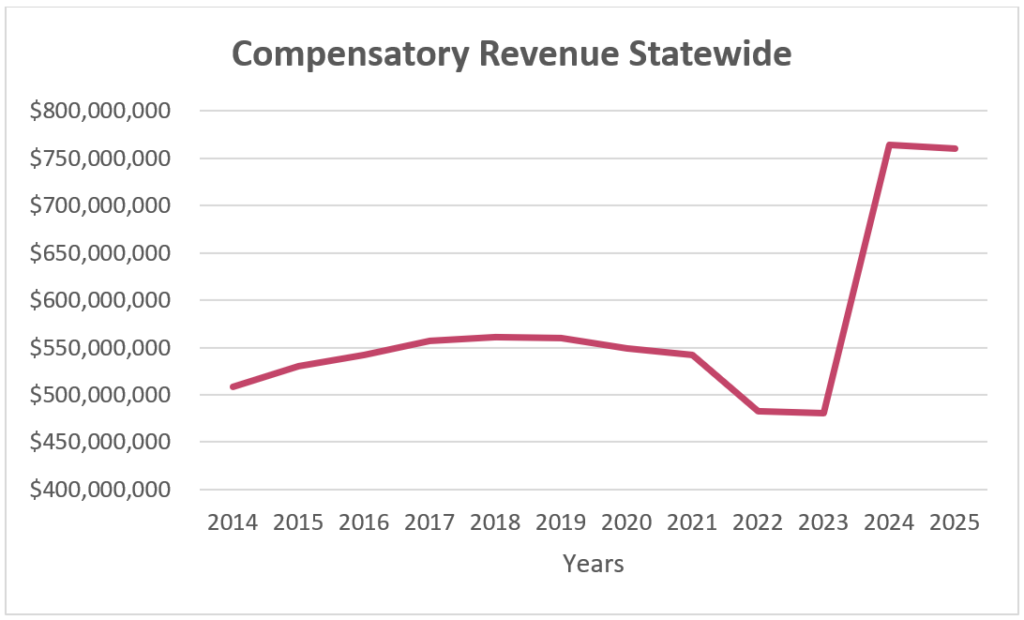
What caused Compensatory Revenue to decline by $60m or 12.4% statewide from FY21 to FY23 and then rebound $280m or nearly 60% in FY24, just one year later? Prior to that, Compensatory Revenue statewide was somewhat boring as it grew slowly and steadily from 2014 – 2018 when it plateaued at $560m. It’s not boring any longer. FY25 is projected to be $200m or 36% more than the previous high year, FY18, as can be seen in this graph.
How did this rollercoaster of great decline and even greater rebound occur? Is it sustainable? What other changes have been made to Compensatory revenue?
MREA is digging into compensatory revenue with a four-article series:
- The Great Decline from 2021 to 2023 (this article)
- The even Greater Rebound 2023 to 2024 (Jan 8)
- The effects on site revenue (Jan 22) , and
- The transition to all Direct Certification and the sustainability of this level of funding (Feb 5).
The Great Decline—Going Down the Comp Rev Rollercoaster FY21-FY23
There are four parts of the Compensatory Revenue formula defined in statute (MN 126C.05 Subd 3) that we’ll dive into today that are cause of the devastation to districts’ Compensatory revenue caused by the COVID Pandemic.
- Compensatory Free and Reduced Pupil Unit count (CPU)
- Compensatory concentration percentage
- Compensatory weighting factor
- Compensatory revenue aid associated with each CPU
- Compensatory revenue per district FY 21- FY 23
Free and Reduced Pupil Unit Count
Students eligible for Free Lunch count as one CPU and Reduced Lunch eligible students count as half a CPU. Let’s consider an example of a school site with 125 Free lunch students and 50 Reduced Lunch students. The Compensatory pupil unit count (CPU) would be 150.
125 + (50/2) = 150
For a student to be counted as Compensatory pupil unit (CPU), they must be enrolled at a school site Oct 1 of the previous year and have qualified for Free or Reduced Lunch Eligibility (FRE) by Dec 15 of that year. That locks in the CPU for the succeeding school year. The specific student(s) may leave; not be qualified for FRE in the future; it doesn’t matter. The CPU number is locked in.
This year-long lag provides predictability in funding a year out which allows for rational budgeting and staffing in the spring prior to beginning of the next school year.
With this said, in the fall of 2019, all districts and charter schools Compensatory revenue numbers were set for the next school year, 2020-21, or FY21.
To understand the Great Decline, and the Great Rebound from FY2023-24, we need to remember what happened in those years. In the fall of 2020—the first year of the pandemic, many schools closed or were open only part of the time, all students receiving free meals, many districts delivering meals to drop off sites. To say collecting paper applications for FRE was a challenge is an understatement. The similar set of circumstances occurred in the fall of 2021. All families were receiving free meals due to Federal relief dollars and had not been paying for meals for a year. While schools were in session, collecting paper forms was challenging when the forms didn’t actually matter as to whether a student received a free meal.
Statewide, the CPU Free and Reduced count fell over 13% between the fall of 2019 and 2022. It is a testament to food service directors and others that the statewide percentage of completed paper applications fell by only 13%.
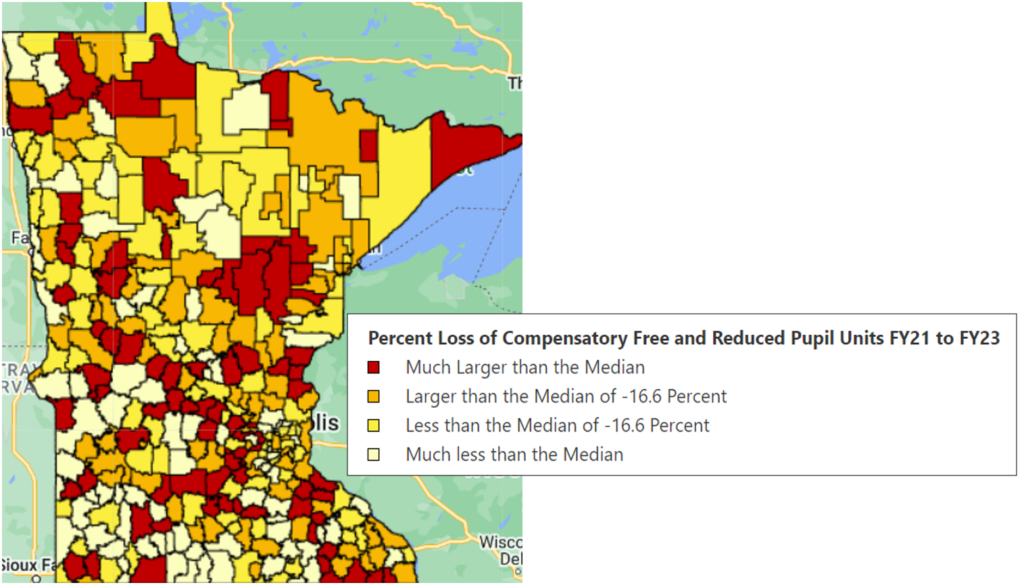
The median district decline in the Compensatory Free and Reduced count was 16.6%. Half of the districts’ declines were larger and half were smaller. The distribution can be seen in this map. Find your district’s CPU decline at this link to the interactive map.
Compensatory Concentration Percentage
Before going further, it is important to note that Compensatory revenue is calculated at the school site level, the same level that MCA test scores are reported. The third article will focus on the effect of 2023 legislation on the revenue and expenditures at sites. For the purposes of discussing the Great Decline and Rebound all data will be summed at the district level.
The concentration weighting factor is based on long-standing research that the concentration of students in poverty in a school has more effect on students’ achievement than when students in poverty make up a smaller proportion of a schools’ student body. As one 2018 research article put it,
“Over the last five decades, a large body of research has demonstrated that concentrated school poverty undermines the educational progress of all students, especially pupils who are poor themselves.” (Mickelson, R.A.; Sept. 2018; p. 2)
The concentration percentage is the ratio of the site’s CPUs to the site’s total student enrollment on Oct 1 of the previous fall, the same date as the CPUs needed to be enrolled.
In a site with 500 students, the concentration percentage for our example site is 30%.
(150/500) = .30 X 100 = 30.0%
A more concentrated example would be those 150 students in 400 student site yielding a concentration percentage of 37.5%.
(150/400) = .375 X 100 = 37.5%
A less concentrated example would be those 150 students in a 700 student site yielding a concentration percentage of 26.7%.
(150/700) = .214 X 100 = 21.4%
Compensatory Concentration Weighting Factor
Then the statute takes that concentration ratio and divides it by 0.8, which is the same mathematically as multiplying the ratio by 1.25, and finally multiplies the resulting decimal by 100 to create a percentage. The percentage is capped at 100%.
Let’s take the example from above and assume those 150 CPUs are in a site with 500 student total enrollment the previous Oct 1.
The CRWU for our example site would be .375 which is very close to the district median for FY21.
(150/500)/.8 = .30/.8 = .375 X 100 = 37.5%
A more concentrated example would be those 150 students in 400 student site yielding a CRWU of 46.9% which is very close to the FY21 75th percentile of Minnesota school districts.
(150/400)/.8 = .375/.8 = .469 X 100 = 46.9%
A less concentrated example would be those 150 students in a 700 student site yielding a CRWU of 26.7% which is very close to the FY ’21 25th percentile of Minnesota school districts.
(150/700)/.8 = .214/.8 = .267 X 100 = 26.7%
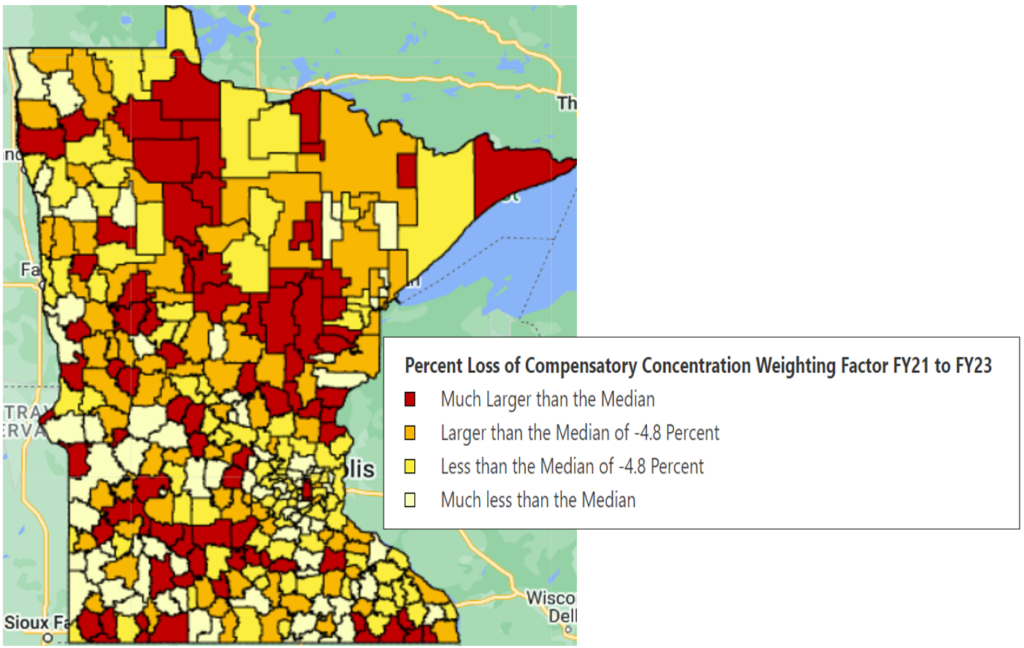
Fortunately, districts’ enrollment held up better in COVID than did the completion of paper Free and Reduced lunch applications. But this meant that districts generally, on paper, had lower concentrations of students in poverty as measured by compensatory weighting factor. The median district loss in the concentration weighting factor from FY21 to FY23 was 4.8%. The distribution can be seen in the map below. Find your district’s Compensatory concentration weighting factor decline at this link to the interactive map. Remember this is a ratio of Free and Reduced eligible students to total enrollment.
Both the loss of CPU and CRFU will affect a district’s loss of revenue. Since the revenue associated with each weighted CPU is the same statewide, each district’s combined percentage loss of CPU and CRWF is the same percentage as the percentage loss in revenue. The relative strength of the loss of CPUs and the CRFU will be somewhat different for each district.
Compensatory Revenue per CPU
The Compensatory revenue pupil units (CPU) are calculated by taking the sum of Free lunch eligible students plus half the Reduced lunch eligible students and multiplying that number by the concentration weighting factor.
The statutory formula for the Compensatory revenue associated with each CPU is as follows:
.6 X (Formula Allowance-$839)
For FY21 this was as follows:
.6 X ($6,567 – $839) = $3,436.80
For FY23 this was as follows:
.6 X ($6,863 – $839) = $3,614.40
This is a 5.2% increase over these two years. The increased Compensatory revenue per CPUs, generated by an increase in the basic formula allowance, helped offset to some degree the decreases in Compensatory pupil units and concentration weighting factor.
Compensatory Revenue per District FY2021-23
The full formula for a site’s Compensatory revenue is as follows:
(Free and 1/2 Reduced CPU) X Concentration Percentage/.8 X .6 X (Formula Allowance-$839)
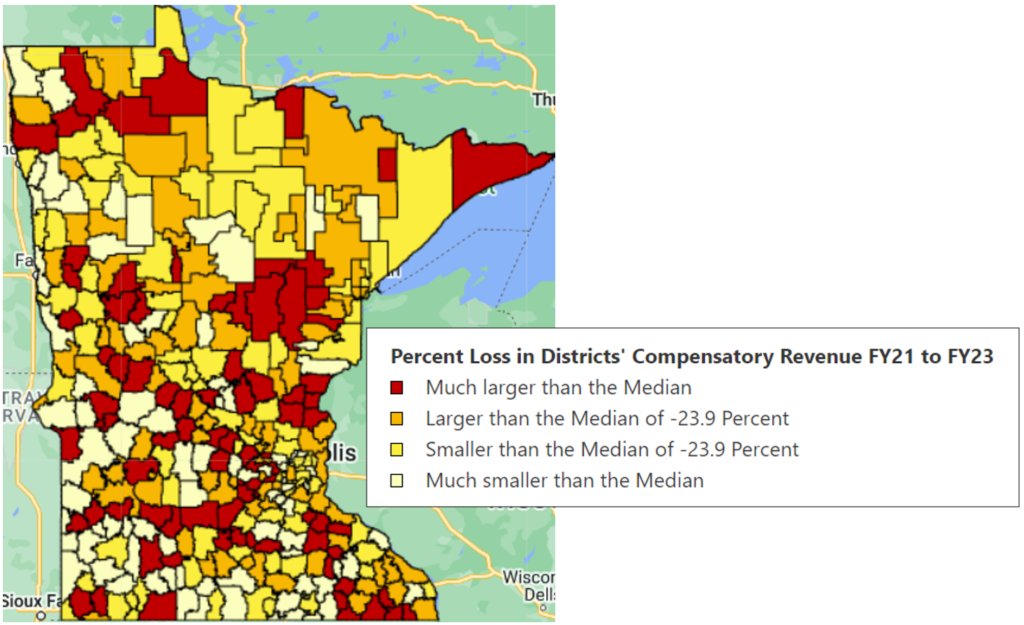
Statewide, the total Compensatory Revenue declined $60m from FY21 to FY23 or 12.4%. But the median district decline was nearly twice that at 23.9%. Clearly there was a wide difference in how districts were affected by the loss in CPUs and CRWF. Nearly all districts who experienced greater than 37% Compensatory revenue loss, shown in red, are in rural Minnesota. That proves that larger metro districts, to a bigger degree, experienced less loss, thereby explaining why the total statewide loss is half the districts median.
The distribution can be seen in the map below. Find your district’s Compensatory revenue decline at this link to the interactive map.
Summary and What’s Next
We are fortunate that these devastating losses were temporary and are in our rearview mirror. The difficulty of collecting paper applications during a pandemic had its effect on Compensatory revenue causing the Great Decline as districts saw losses in what had been a pretty steady revenue stream.
Find all districts FY21 to FY23 Compensatory revenue data changes in this MREA data table.
In our Jan 8, 2024 Insider Brief, we’ll dig into Minnesota’s participation, along with 37 other states, in the USDA’s demonstration project to conduct direct certification with Medicaid for both Free and Reduced price school meals for local education agencies (LEAs) statewide. In the 2022-23 school year, Minnesota joined in this effort, which dramatically affected the FY ’24 Compensatory revenue. In many districts Free and Reduced lunch eligibility shot up and the concentration percentage followed suit as districts, on paper, showed higher concentrations of poverty. Watch your Insider Brief on Jan 8, 2024 as we explore the Great Rebound.