
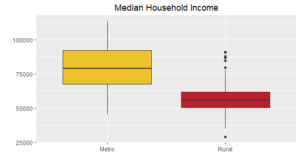
Minnesota faces a large and pervasive household income gap between rural and metro areas that has a direct impact on student educational opportunities across the state. The median household income in rural Minnesota is $23,422 less than metro-area, according to analysis of the latest data available from 2017. MREA examines Minnesota household income data and the effects of the rural-metro divide on students’ education.
Buying Power
Minnesotans paid $2.9 billion in local property taxes to support education of students in their communities, representing 10 percent of the state’s total investment in education. Many of these property taxes are voter approved.
Rural Minnesota passage rates are about 40-60 percent lower than metro passage rates for both school facility bonds and operating referendum revenue. Learn more
Seeking to understand the “why” behind these trends, MREA dug into the median household income data supplied by the US Census 2017 American Community Survey.
RURAL-METRO HOUSEHOLD INCOME GAP BY DISTRICT
7-County Metro: $79,058
Rural: $55,636
Statewide: $57,151
The median metro district falls in the 96th percentile of Minnesota rural school districts.
 Only 4 percent of rural districts are wealthier per household than half of the metro districts.
- The median rural district lands in the 14th percentile of metro districts in the state.
- This represents a 2:3 rural to metro ratio.
- That translates into metro households having 50 percent more buying power for everything, including property taxes.
The wealth disparity becomes even more significant, when accounting for the the number of household incomes in districts.
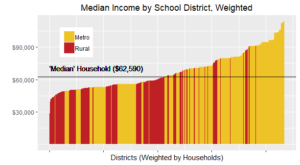
When measured this way:
- The statewide median household income increases about $5,400 to $62,590 when measured this way
- The new median would be the 77th percentile in rural districts, and is only the 20th percentile of metro districts.
About 38 percent of the 2.2 million households in Minnesota are in rural school districts.
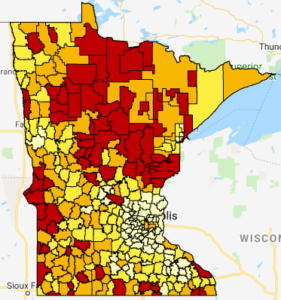
What is your district’s median household income?
The districts highlighted in red fall in the lowest quartile for household income in the state. The orange districts fair better, but still fall below the median household income in the state.
Those in the lightest yellow represent the districts with the highest household income in the state.
The 2:3 rural to metro median household income rates impact passage rates.
How does buying power impact passage rates? MREA did the math, applying this 3:2 ratio to passage rates:
If 80% of metro bonds pass, then the expected passage rate for rural bonds should be 53 percent — which has been the historical pattern.
Rural passage rates did increase in November 2018, when the state began picking up a larger share of the cost of school facilities, through the new Ag2School tax credit. Ag2School provides owners of agriculture and timber land a credit on school bonds. Benson Superintendent Dennis Laumeyer credits Ag2School for his communities support for the bond question in August. Learn more about Ag2School.
“There is no way the Benson School bond would have passed without that tax relief in place,” he said. “Because of Ag2School, Benson Schools will be able to replace 90-year-old buildings with learning spaces that meet 21st century learning.”
What’s Next?
The analysis shows that Minnesota’s rural students depend on state aid and equitable tax policy, which needs to take into account the 2:3 rural to metro ratio in median household income both for school bond payments and for operating referendum revenue.
………………………….
For this analysis:
-
Rural districts are all Greater Minnesota districts < 7,500 APU
-
Metro districts are those within the 7-county metro and the Duluth, Elk River, Mankato, Rochester and St. Cloud school districts
Data source for Household income: U.S. Census Bureau; American Community Survey, 2017 ACS 5-Year Estimates, Table S1903; generated by Phil Jensen; using American FactFinder; <http://factfinder.census.gov>; (27 February 2019)