
Part I – Total General Fund Increase
Throughout the summer, MREA will be analyzing the revenue portion of what was received in the new legislation passed earlier this year. Minnesota Department of Education (MDE) spreadsheet shows increases in revenue for each district. MDE uses AADM, the Adjusted Average Daily Membership, as a way of looking at students in each district. The “adjusted” part of this figure removes a district’s tuition students served from their average daily membership count.
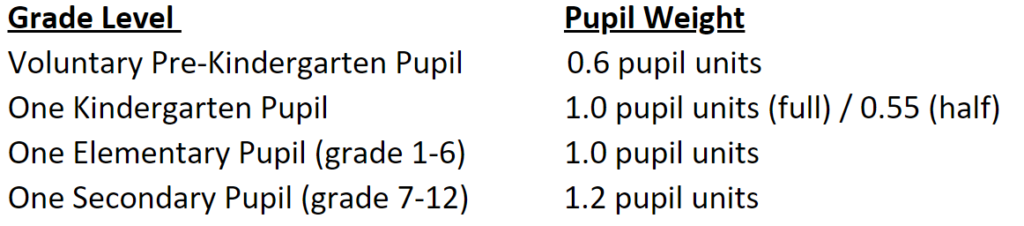
MREA uses APU (Adjusted Pupil Units) in its data, which we believe is a more helpful way to represent the given data. APU is used to determine revenue in many funding formulas. The APU formula uses the following formula to determine pupil weight:
This spreadsheet shows APU data for each district.
MREA will investigate and explore the different major revenue sources shown on the spreadsheet such as transportation sparsity aid, English Learner (EL) and Special Education Cross Subsidy Aid, and the rest of the categorical aids that were increased during the 2023 legislative session.
Major Categories of New Revenue
Today, we’ll explore how each district is impacted by the almost $1.6 billion in statewide revenue that was put into district’s General Fund in this spreadsheet. The total dollars received for this biennium was $2.267 billion, so while the above spreadsheet is not comprehensive, it does address the major revenue sources increased at the legislature. There are many grants and other revenue sources a district may receive from this funding stream that are not shown on the spreadsheet. One example is the $135 million for Unemployment Insurance that cannot be represented on this spreadsheet until each district determines their cost and is reimbursed for it.
All districts in the state have different needs and many times the categorical aids help level the playing field based on these unique needs.
As we explore funding sources and revenue streams this summer, we’ll help uncover why not all districts receive the same dollar amount per APU.
The map below shows the total revenue increase that districts receive for FY24 and FY25 because of the new legislation.
MREA Map: Total General Fund Increase
The total dollars per APU in FY24 and FY25 ranges from $1,200/APU to $7,752/APU, with the median being $1,811/APU.
Historically speaking, districts are receiving a significant amount, though we know this money comes with some costs to districts as well. Unemployment Insurance, additional classes in the curriculum, Family Medical Leave, and additional TRA costs are a few of the added expenses that districts will face.
Eighty-nine percent of districts in the upper quartile who receive the most dollars per APU were rural districts. The same can be said for the bottom quartile where 88% of the districts who receive the least dollars per APU are rural districts.
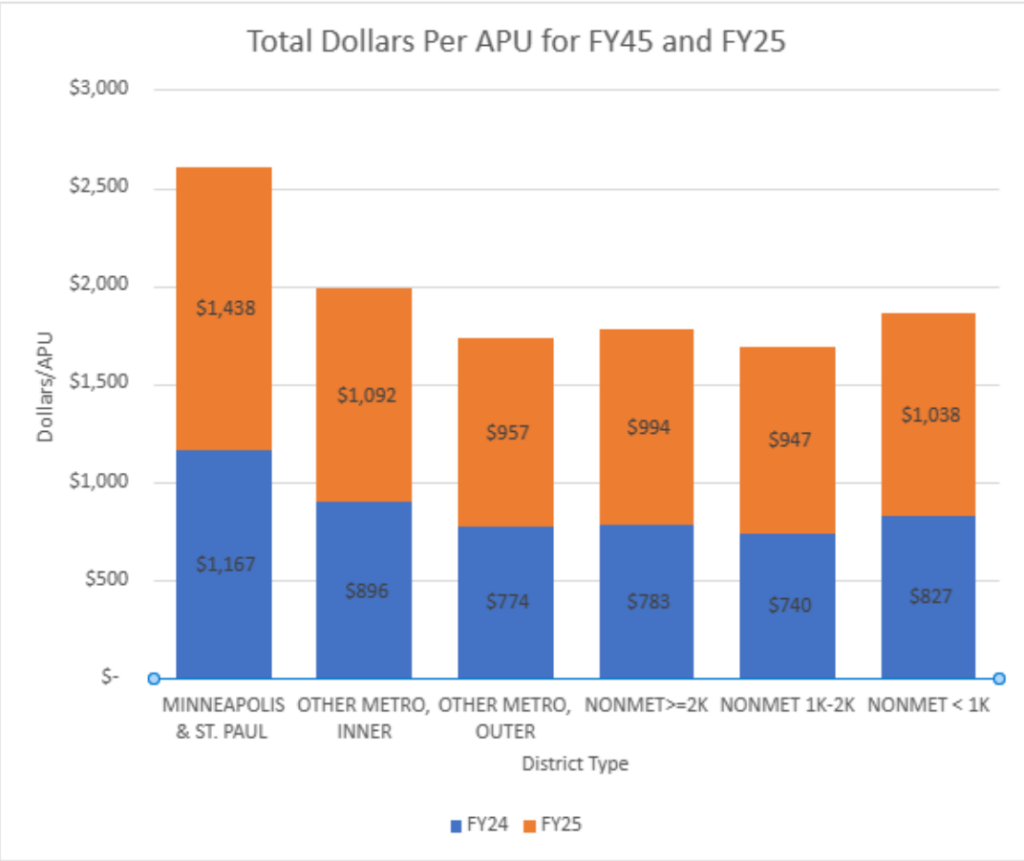
The difference between the districts with the greatest (Minneapolis/St. Paul) and least (Non-Metro 1K-2K) dollars per APU is $918/APU. The chart above shows that Minneapolis/St. Paul receives significantly more funding than other district types. MREA’s map above indicates that the dollars per APU received was truly dependent on what the needs of the district were and where the priorities of the legislature were placed.
Why the Significant Differences?
To answer this question, we need to follow the money. Looking at total dollars from the spreadsheet above, you’ll see that dollars on the Basic Formula Allowance and Special Education Cross Subsidy Aid had the greatest increase, followed by English Learner Aid.
As a reminder, every district will get the same amount per pupil on a 4% and 2% formula increase, which equates to $275/APU in FY24 and an additional $143/APU in FY25. In FY24, districts will receive $7,138/APU, and in FY25 they will receive $7,281/APU.
If we made a graph on the increase in the Basic Formula Allowance (Column F) every district should be equal. However, the other revenue streams that are tied to the Basic Formula Allowance (Column G) can vary. These include Declining Enrollment, Sparsity, Sparsity Transportation, and Compensatory Aid. Compensatory is one of the bigger revenue streams for most schools.
Further, because of direct certification of Medicaid eligible students, most districts will be seeing significant increases in their Compensatory dollars in FY24. This increase is unrelated to this session’s legislation, however, Compensatory Aid is tied to the Basic Formula Allowance, so any increase in the formula will increase Compensatory dollars.
Many districts will see reductions in their Special Education and English Learner cross subsidies with the new legislation. The data shows that districts who had a high Special Education Cross Subsidy, Compensatory and/or English Learner Cross Subsidy receive more aid than districts that do not. This is somewhat of a catch-22. To receive more funding from the Cross Subsidy aides, districts would have had more money being taken from their general fund to pay off the extra costs of Special Education and English Learner Education mandates.
Key Takeaways
- All districts statewide received a historic increase in funding, but attached to this are additional mandates that will take away from this increase.
- Some districts received more than others because of the unique needs of their student population.
- To truly understand the disparity between revenue allocated, we must dig deeper into each of the revenue streams associated with the new legislation.
Next Up – Basic Formula Allowance increases
In the upcoming articles, MREA will investigate how these different funding streams worked together to sum up the Total General Education increases that we discussed in this article.
On July 24, MREA will explore the Basic Formula Allowance increase and revenues associated with this revenue stream.