
Part II: Compensatory Education Revenue
The Rebound – Going Up the Compensatory Revenue Rollercoaster 2021-24
How did this rollercoaster of great decline and even greater rebound occur? Is it sustainable? What other changes have been made to Compensatory revenue?
MREA is digging into compensatory revenue with a four-article series:
- The Great Decline from 2021 to 2023 (Dec 7, 2023 article)
- The even Greater Rebound 2023 to 2024 (this article)
- The effects on site revenue (Jan 22) , and
- The transition to all Direct Certification and the sustainability of this level of funding (Feb 5).
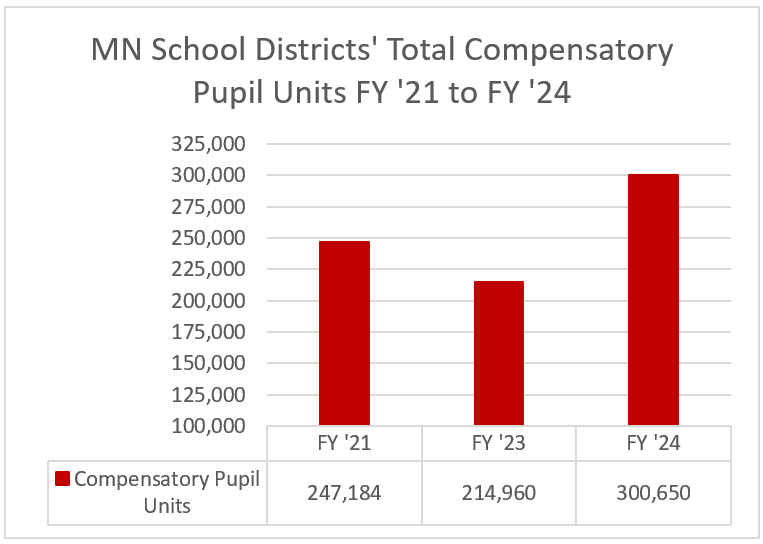
Compensatory Pupil Units
Minnesota’s 331 public school districts’ compensatory pupil unit count was 300,650 as of October 1, 2022 (post-pandemic) with 268,800 students eligible for free lunch and 63,699 students eligible (at a factor of .5) for reduced lunch. This was a 22% increase from the last pre-pandemic Free Reduced Enrollment (FRE), October 1, 2019 and an amazing 40% increase over the October 1, 2021 FRE enrollment. Check out Part I of this series for more information about the decline in Compensatory Education Revenue from 2021-2023.
What could account for this rebound? Direct Certification of Medicaid eligible students. For 2022 and beyond, Minnesota joined USDA’s Direct Certification with Medicaid demonstration project along with 37 other states. Direct Certification has been part of the Child Nutrition and WIC Reauthorizations since 2004. The program “is a method of eligibility determination that does not require families to complete school meal applications. Instead, school officials use documentation from the local or state welfare agency that indicates that a household participates in AFDC or food stamps as the basis for certifying students for free school meals.” (USDA website)
Minnesota automatically matches Department of Human Services data with student enrollment data. This direct certification has been in place for the first four programs below for many years, however, Medicaid was added in 2022, leading to a significant increase in compensatory revenue for districts.
- Supplemental Nutrition Assistance Program (SNAP)
- Minnesota Family Investment Program (MFIP)
- Food Distribution Program on Indian Reservations (FDPIR)
- Foster Care students placed by County Human Services
- Medicaid
School districts are notified by MDE July 1 of FRE eligible students who were matched using Direct Certification. An updating process goes on continually, throughout the school year between school districts and MDE through the Minnesota Automated Reporting Student System (MARRS). For compensatory revenue purposes, district enrollment is locked on October 1, but students can become eligible for FRE and therefore become part of the compensatory pupil unit count up to December 15 of that school year. This then creates the compensatory revenue for each district in the subsequent school year.
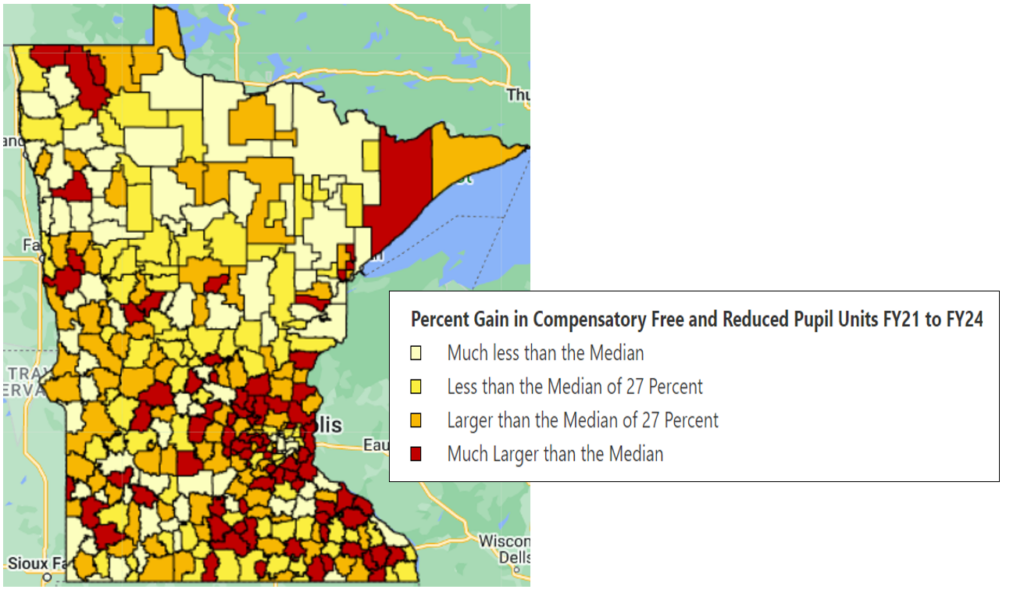
The median district growth in Compensatory Revenue Pupil Units (CPU) from FY’21 to FY’24 was 27%. The map below shows the distribution. Find your district’s CPU increase.
The Impact of Paper Applications
Minnesota districts must still inform families and households of their ability to apply for FRE status by submitting paper applications, even if they didn’t qualify via Direct Certification. Districts receive applications, determine eligibility, and record that status in MARRS. In addition to Direct Certification students, paper-application eligible students count towards USDA reimbursement for meals (lunch and breakfast), and in some districts provides student eligibility for reduced athletic fees and certain scholarships.
In the fall of 2022, 12.8% (34,609) of the Free Lunch students and 38.6% (24,650) of the Reduced Lunch students were determined to be eligible by paper applications. Together, this amounts to 15.5% (46,934) of the Compensatory pupil unit count of 300,650 for FY’24.
MREA will provide further insight to paper applications when FY’24 and FY’25 Compensatory revenue data is reported by MDE. For both FY’24 and FY’25, paper application eligible students are included in the CPU count. But by statute, beginning October 1, 2024, it is possible CPU will only be determined through Direct Certification (MN 126C.10 Subd 3b). This will affect FY’26 and beyond.
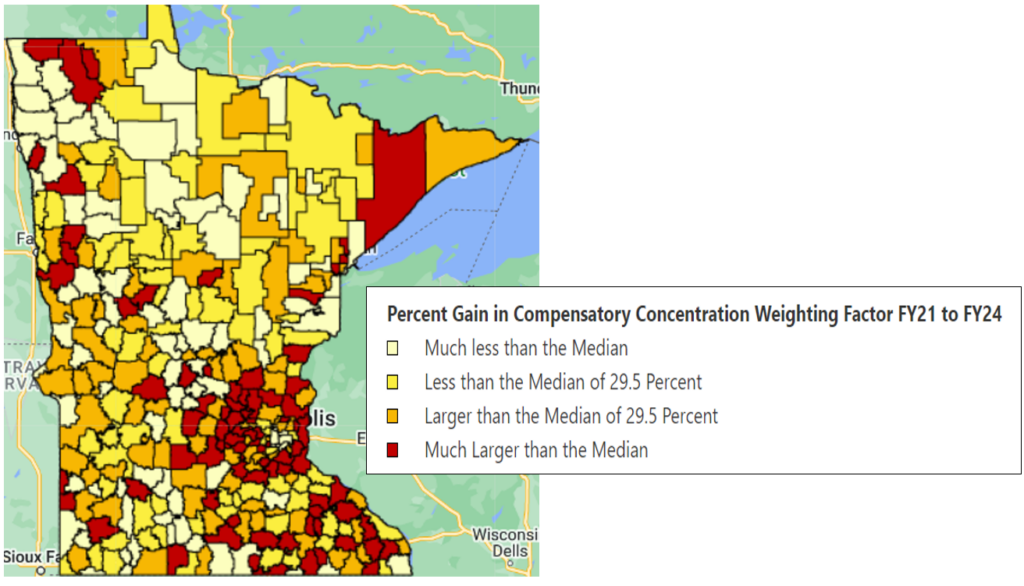
Compensatory Concentration Weighting Factor
Compensatory revenue is affected by the pupil unit count and concentration weighting factor. The concentration weighting factor is the ratio of the CPU to the district’s total enrollment. As noted above, CPU has increased significantly. In contrast, statewide, public school district enrollment actually fell 3.5% between FY’21 and FY’24.
With these numbers going in opposite directions for many districts, it is no surprise that there was an increase of nearly 30% in the districts’ Compensatory Weighting Factor (CRWF). The distribution can be seen in the map below. Find your district’s increase.
Compensatory Revenue
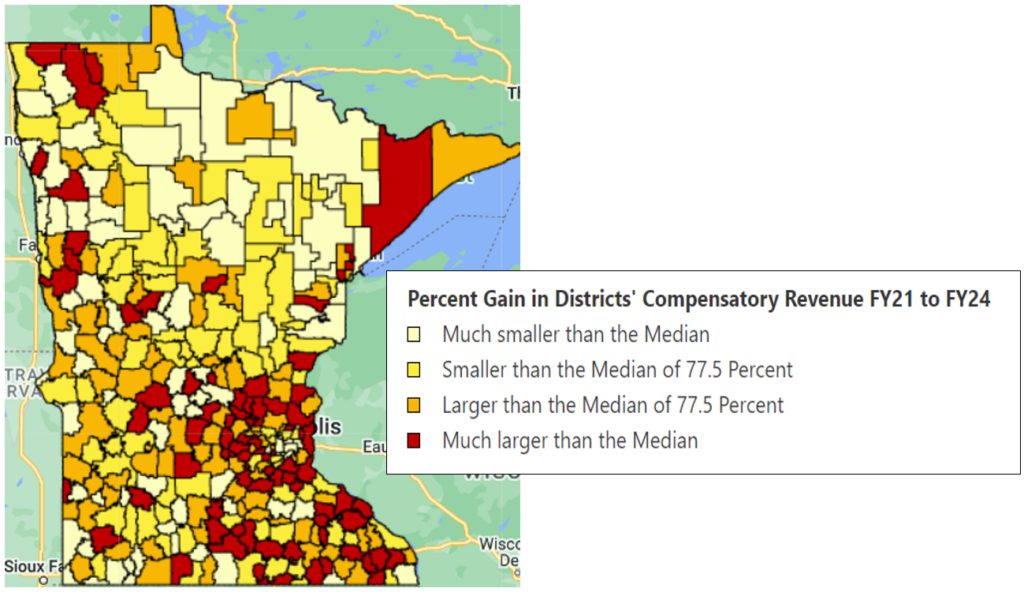
The product of the increases in CPU and CRWF resulted in a 51.5% increase in Compensatory Revenue from FY’21 (pre-pandemic) to FY’24 (post-pandemic with direct certification with Medicaid and paper applications). From FY’23 to FY’24, it was an astounding 79.1% increase in compensatory revenue.
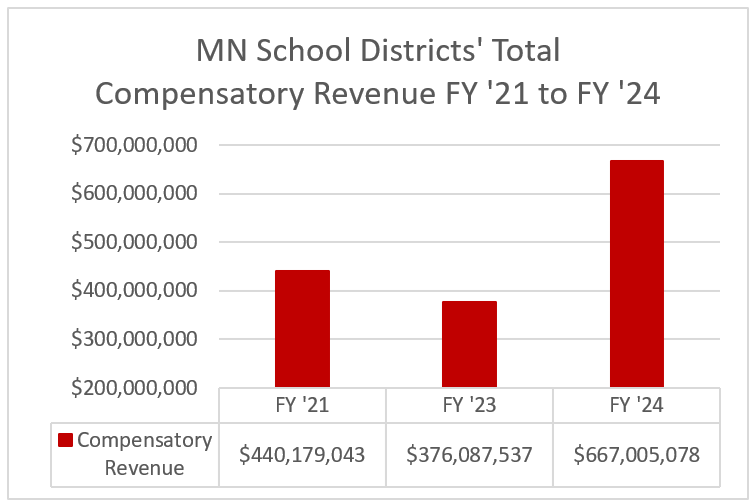
From FY’21 to FY’24, the Basic Formula Allowance increased 10%, which is included in the 51.5%. But even with that excluded, there remains a 41.5% increase due solely to the increases in CPU and CRWF.
Minneapolis and St. Paul are the largest recipients of compensatory revenue, absorbing 17% of the total statewide revenue. However, they had relatively small gains, primarily due to significant drops in enrollment. As a result, 96% of the $227 million increase in compensatory revenue statewide between FY’21 and FY’24 was distributed to the other 329 school districts.
The distribution can be seen in the map below. Find your district’s increase.
Key Takeaways
- Minnesota’s participation in USDA’s Direct Certification with Medicaid Demonstration Project, along with 37 other states, dramatically increased the number of students eligible for Free and Reduced meals.
- This CPU increase drove up the CRWF for nearly all districts.
- The combined increases of CPU and CRWF resulted in a 51.5% increase in statewide school district compensatory revenue from FY’21 to FY’24.
- From FY’23 to FY’24, it was an astounding 79.1% increase in compensatory revenue, most likely due to Direct Certification with Medicaid.
Find all districts FY21 to FY24 Compensatory revenue data changes in this MREA data table.
What’s Next?
The 2023 Legislature increased the Compensatory revenue from 50% to 80% that must be expended at the site where it is generated and reduced the allowable expenditures. MREA will explore these effects on site revenue and expenditures in the January 22 Insider Brief.