
Part III – Special Education and English Learner Cross Subsidies
In this article MREA will look at how the revenue increase was distributed throughout the state for the reduction in Special Education Cross Subsidy and the English Learner Cross Subsidy. When looking at the major revenues from the 23 Legislative Session, MDE’s spreadsheet shows this as one of their highest financial priorities. Nearly 50% of the revenue from the spreadsheet is allocated to cross subsidies. In comparison, about 43% of the FY24 and FY25 revenue increase was allocated to the Basic Formula Allowance.
The Special Education Cross Subsidy and the English Learner cross subsidy were reduced significantly in different ways in FY24 and FY25. With the Special Education cross subsidy, the state will now pay a significantly higher percentage of a district’s cross subsidy. With the English Learner cross subsidy, the state is increasing the revenue paid to districts, which should create less cross subsidy. MREA’s March 6th, 2022 article will help clarify both cross subsidies and the formulas tied to them.
Special Education Cross Subsidy
The Special Education revenues are forecasted numbers and should not be used for budgetary reasons from the MDE spreadsheet. For this article’s purpose, we want to see where the money is projected to be distributed throughout the state. The legislature increased the Cross Subsidy Aid to 44% for FY24 -FY26 and 50% from FY27 on. This was an increase from 6.43% in FY23. A school district’s annual cross subsidy reduction aid equals the school district’s initial special education cross subsidy from the previous fiscal year times the cross-subsidy aid factor for that fiscal year. This aid is specific to a district’s non-federal expenditures. Every district in the state has a special education cross subsidy so reducing the cross subsidy helped all districts. However, some districts had greater special education cross subsidies than others.
MREA’s map shows the forecasted numbers. The median Special Education Cross Subsidy reduction was $692/APU for FY24 and FY25.
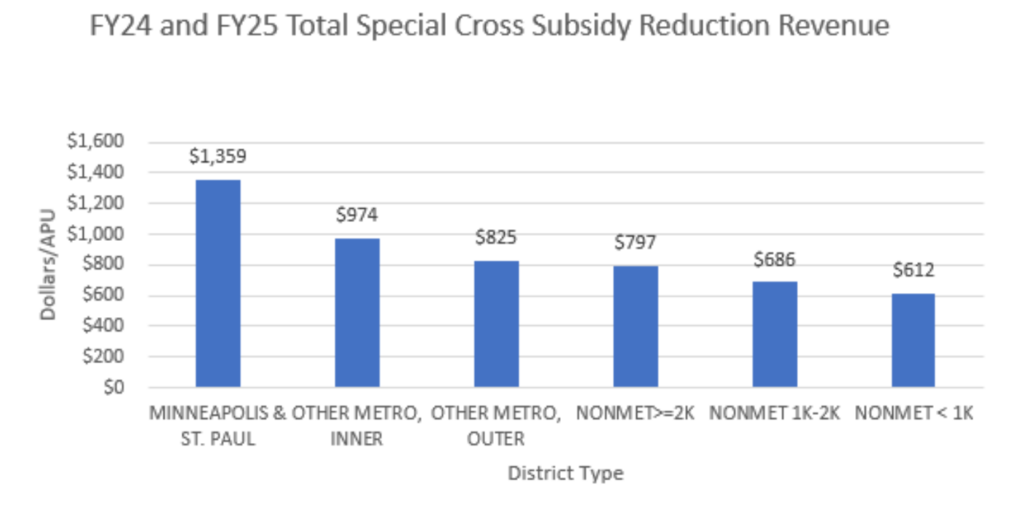 The chart shows that Minneapolis & St. Paul received the most funding from the reduction in the Special Education Cross Subsidy Aid while the smaller districts, overall, did not see as much revenue/APU. Overall, this is good because it means rural districts did not use as much of their general fund on this underfunded mandate.
English Learner Cross Subsidy
English Learner Cross Subsidy Aid was another focus of the 2023 Legislative Session. Although the amount of money that was allocated was only a fraction of what was allocated for the Special Education cross subsidy, it was still a significant amount.
Not every district receives this Cross Subsidy aid. Seventy districts do not receive any of the new aid, as they do not have an EL cross subsidy. There are a couple of moving parts to this aid, and the MDE spreadsheet only shows the English learner aid portion. This is an increase in revenue aid and not a percent reduction in the cross subsidy like the Special Education cross subsidy aid.
The new Basic EL Revenue formula for FY24 through FY26 is:
- Basic EL Revenue = $1,228 x district’s EL Pupil Units (minimum of 20)
- EL Concentration Pupils = EL pupils x the lesser of:
-
- 1; or
- (EL pupils/ADM)/.115
- EL Concentration Revenue = $436 x the district’s EL concentration pupils
- Total Baseline EL revenue = Basic Revenue + EL Concentration Revenue
The legislature increased the EL aid from $704 in FY23 to $1,228 in FY24-26. The legislature also increased the concentration factor from $250 to $436 times the EL concentration pupils for FY24-26.
In FY27, the basic revenue multiplier will be increased again to $1,775; and the concentration factor to $630 times the EL concentration pupils.
For FY27 and beyond, a 25% EL Cross Subsidy Aid will be introduced that equals 25% of the district’s EL cross subsidy. The cross subsidy will be based on the qualifying services from two years prior. For example, FY27 cross subsidy will be based on the difference between FY25 expenditures and FY25 revenues.
MREA’s map shows the distribution of revenue per district.
The median revenue for the districts who received the aid was $34/APU. The data shows that metro districts received above the median for this aid. All the districts who did not receive EL aid were rural districts. Once again, with any cross-subsidy aid, this is a mixed blessing. To receive this aid your district is spending more than it receives in funding, causing your district to spend general fund money on this underfunded mandate. In essence, this is a reimbursement for funding that districts should have had in the first place.
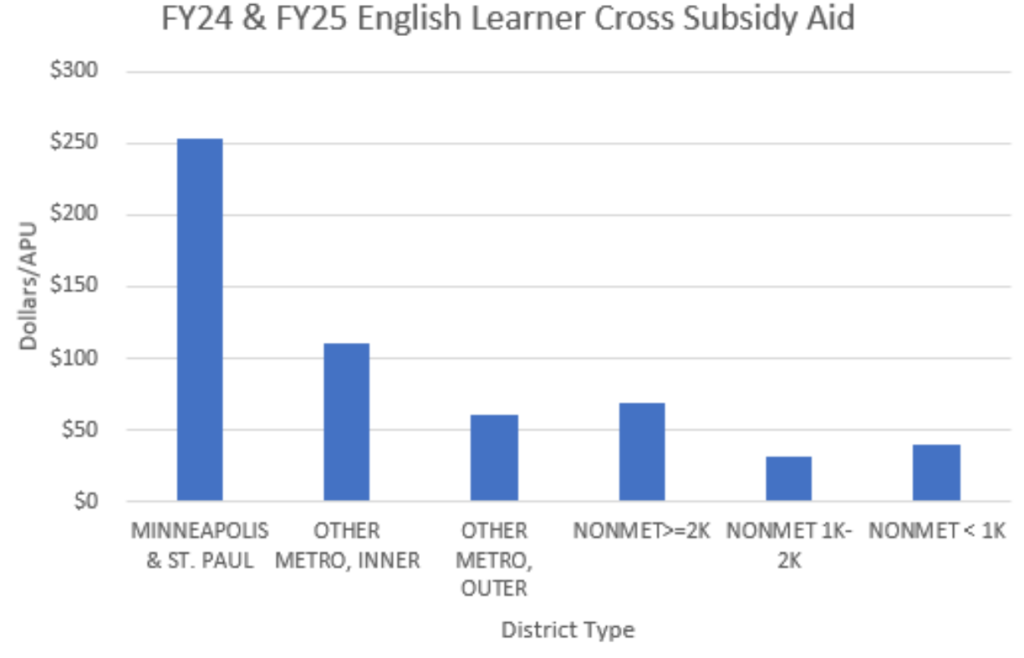
The graph above emphasizes that the metro districts received more money per APU in this funding stream than the rural districts. There are some rural districts that have larger populations of English Language Learners that will receive help with this aid, but metro districts tend to have higher concentrations of English Language learners.
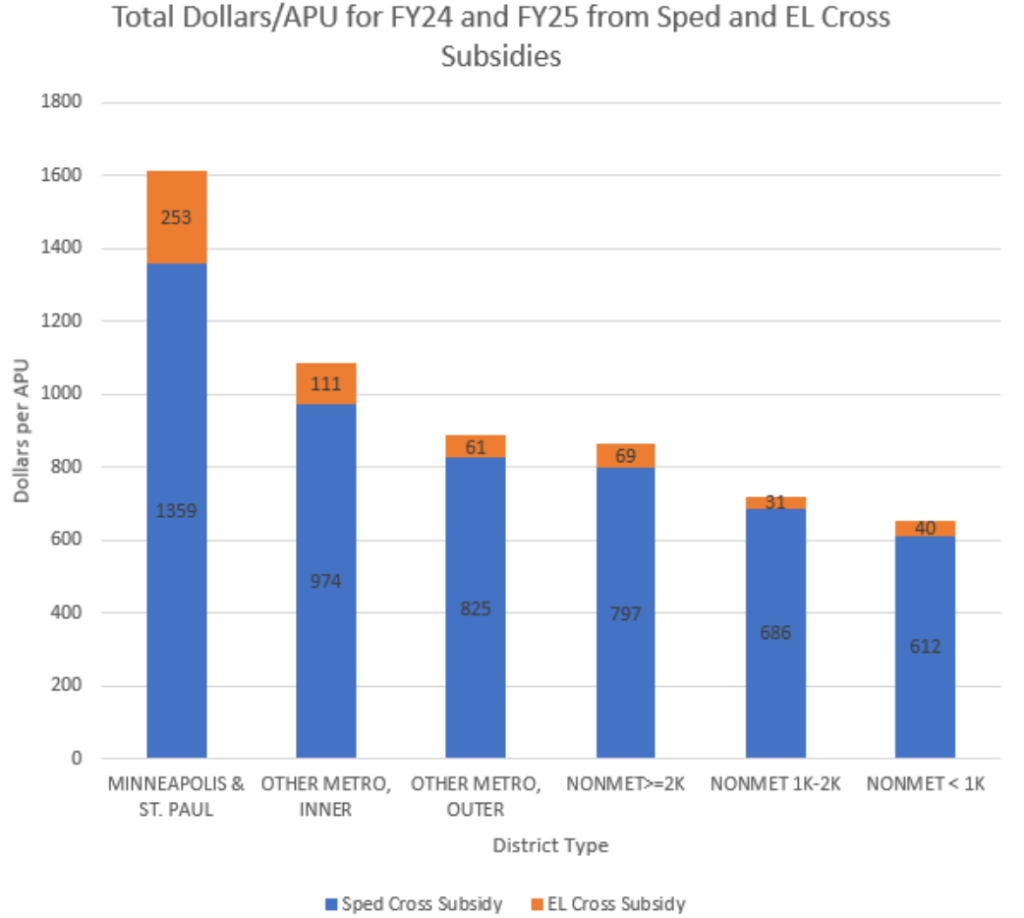
Looking at total dollars for both cross subsidies, you’ll see that the larger districts receive more aid. These revenue streams are specifically directed at expenses related to students who require additional help, thus increasing the district’s expenses.
Key Takeaways
- Reducing Cross Subsidies was one of the biggest financial priorities of the 2023 Legislative Session.
- To qualify for a cross subsidy, a district needs to spend money from their General Fund to pay the un-reimbursed cost of providing services. This is a catch-22 because to receive more from these new revenue streams, a district needs to spend more out of their general fund.
- Most rural districts have less Cross Subsidy costs than larger districts.
Next Up – Library and School Personnel
Watch your next Insider Brief as we dive into two categorical aides, Library and School Personnel, to see how they impact rural districts.