
Part IV: Compensatory Education Revenue
Compensatory Revenue for FY25 and Beyond
How did this rollercoaster of great decline and even greater rebound occur? Is it sustainable? What other changes have been made to Compensatory revenue?
MREA is digging into compensatory revenue with a four-article series:
- The Great Decline from 2021 to 2023 (Dec 7, 2023 article)
- The even Greater Rebound 2023 to 2024 (Jan 8, 2024 article)
- The effects on site revenue (Jan 22, 2024 article) , and
- The transition to all Direct Certification and the sustainability of this level of funding (this article).
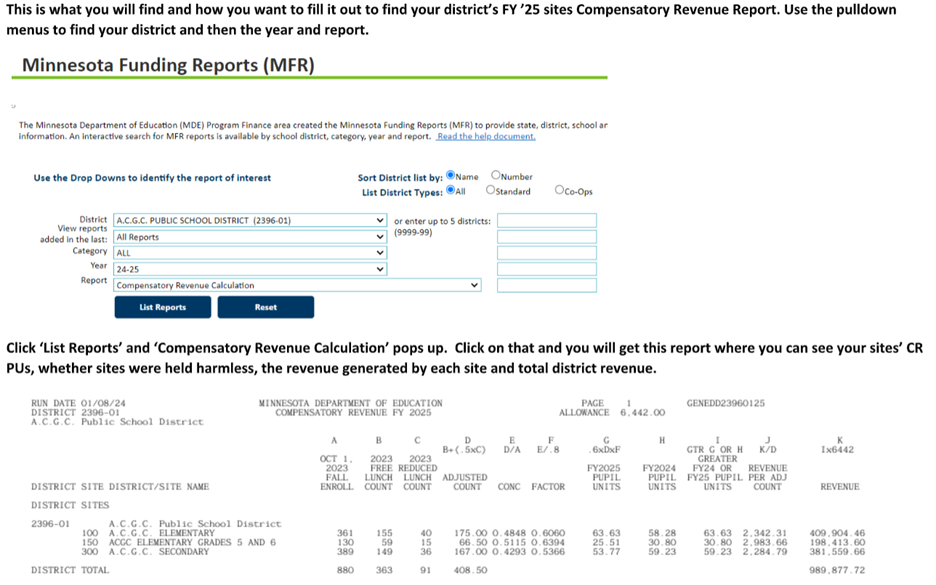
Looking forward to FY25, FY26 and beyond with what can be known today with MDE’s release of FY25 Compensatory Revenue runs, MREA asks and answers the following three questions in this article:
- What are the effects of the FY25 hold harmless calculation that came out of the 2023 legislative session?
- What might be the effects of ending the hold harmless for FY26 and beyond?
- What role do paper applications play in Compensatory Pupil Unit calculations for FY25 and beyond?
What are the effects of the FY25 hold harmless calculation that came out of the 2023 legislative session?
The hold harmless clause is based on Compensatory Pupil Units (CPUs). (MS 126C.10 Subd3(f)) Building (site) CPUs for FY25 are the greater of:
- the CPUs and Compensatory Weighting Factors calculated in the fall of 2023 for FY25; or
- the CPUs and Compensatory Weighting Factors calculated in the fall of 2022 for FY24.
For this article, Compensatory Pupil Units (CPUs) = the total of students eligible for Free meals and half the students eligible for reduced meals. (For an explanation of these calculations, see MREA’s Dec 7, 2023 article.) MREA’s analysis for FY25 and FY24 is at the district level, so will be summary data and approximate calculations.
On a statewide level, districts fall into the following three categories regarding the hold harmless clause:
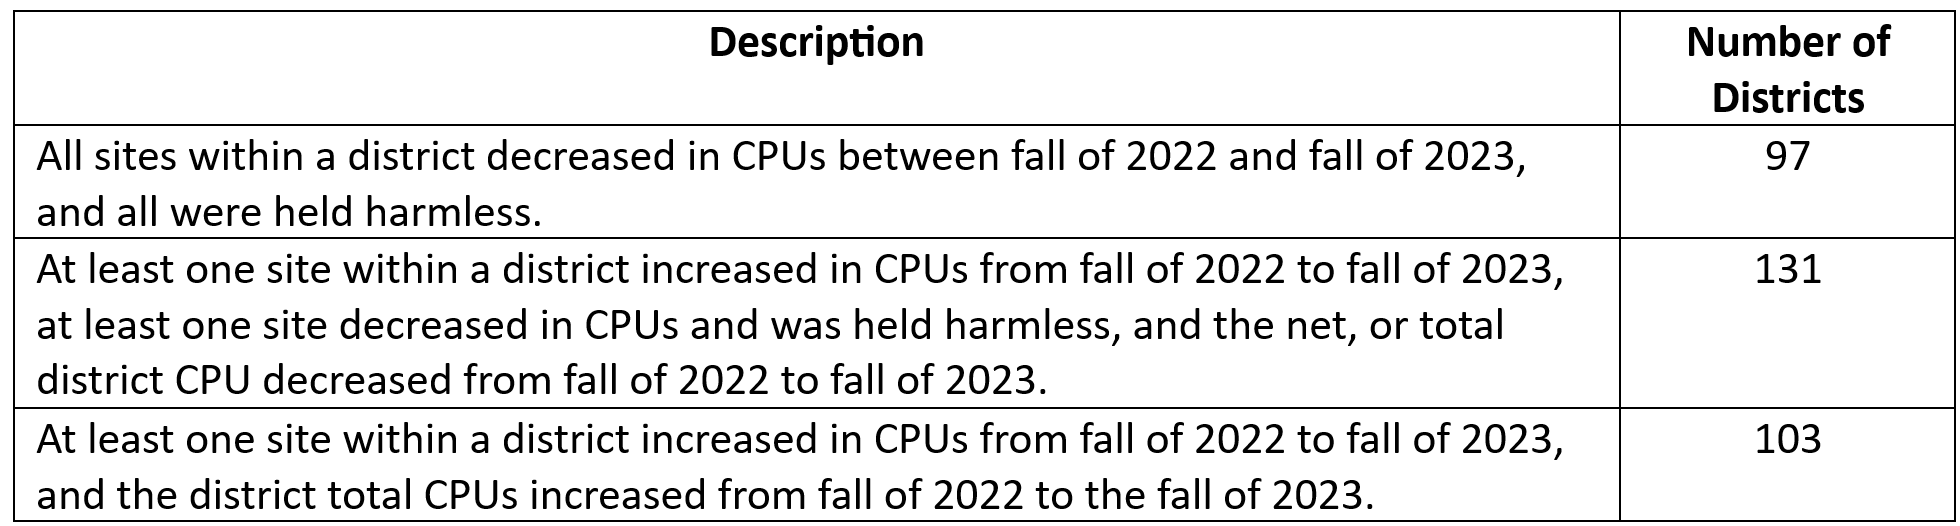
MDE’s FY25 statewide Compensatory Revenue total is $867.8 million for districts and charters. MREA estimates this hold harmless clause increased Compensatory Revenue by $29.7 million for districts and $35.5 million for districts including charters, over what it would have been without the hold harmless clause.
This caught the state by surprise, because in their November 2023 revenue forecast, they stated, “Compensatory spending, a component of general education, is $29 million above end-of-session estimates due to a larger-than-anticipated impact from a hold harmless provision enacted in the 2023 legislative session.” (p. 56). It is also $28.9 million more than their statutory guarantee of $838.9 million for FY26. (MS 126C.10 Subd 3(g))
The median districts’ percent increase in Compensatory Revenue FY24 to FY25 is 5%. The map below shows the distribution. Find your district’s percent increase in Compensatory Revenue here.
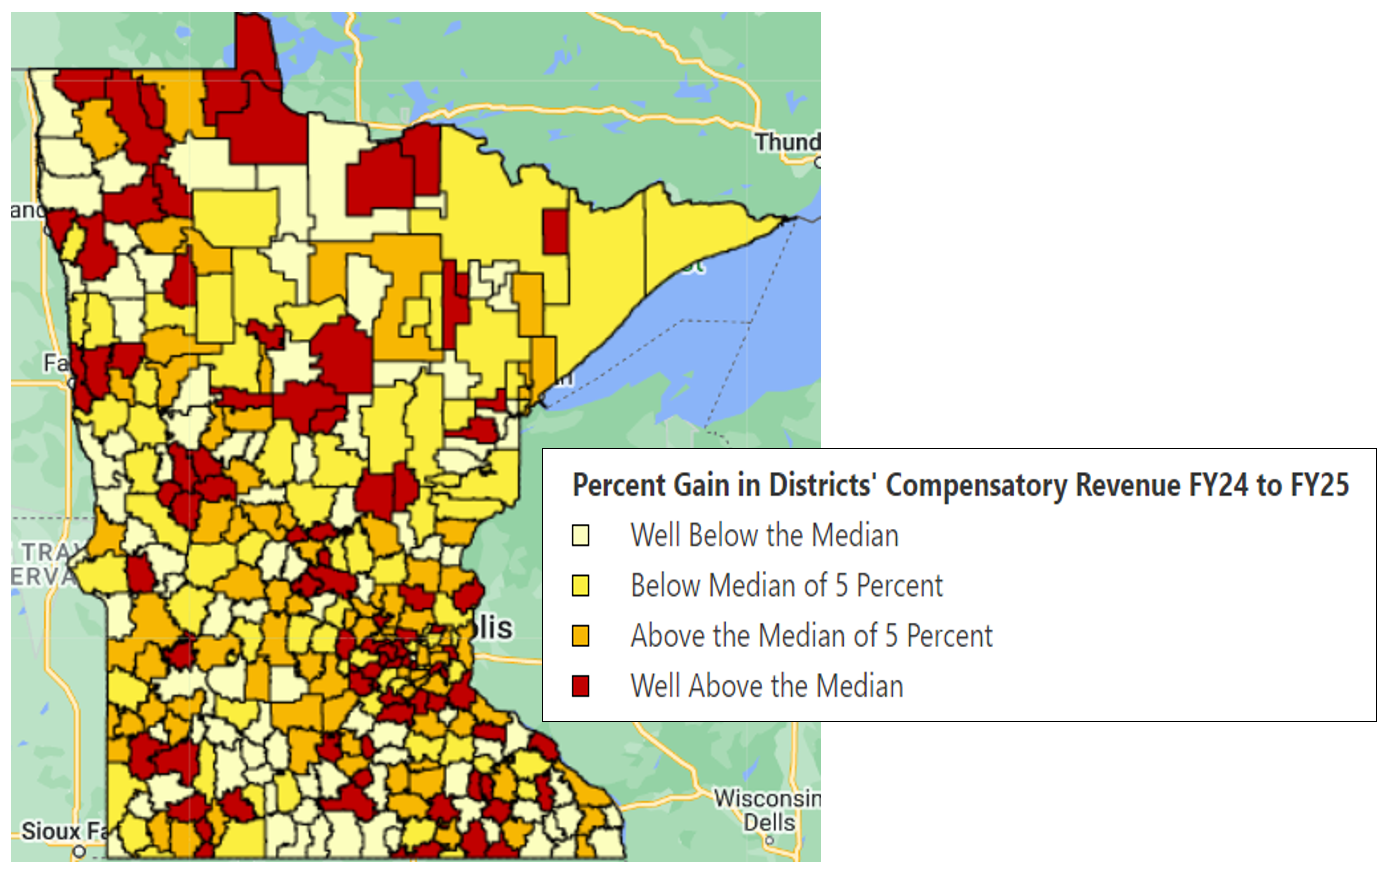
Due to the hold harmless on sites’ CPUs, all but a handful of districts saw an increase in revenue because the formula allowance increased 2% and the compensatory weighting factor magnifies the effects of formula allowance increases on Compensatory Revenue calculations.
What might be the effects of ending the hold harmless for FY26 and beyond?
Since the main driver of Compensatory Revenue are the Compensatory Pupil Units (CPU), what happened between the fall of 2022 (FY24) and the fall of 2023 (FY25) to Compensatory Pupil Units may show the beginning of a trend. What would have happened to compensatory revenue if the hold harmless provision in state statute had not existed?
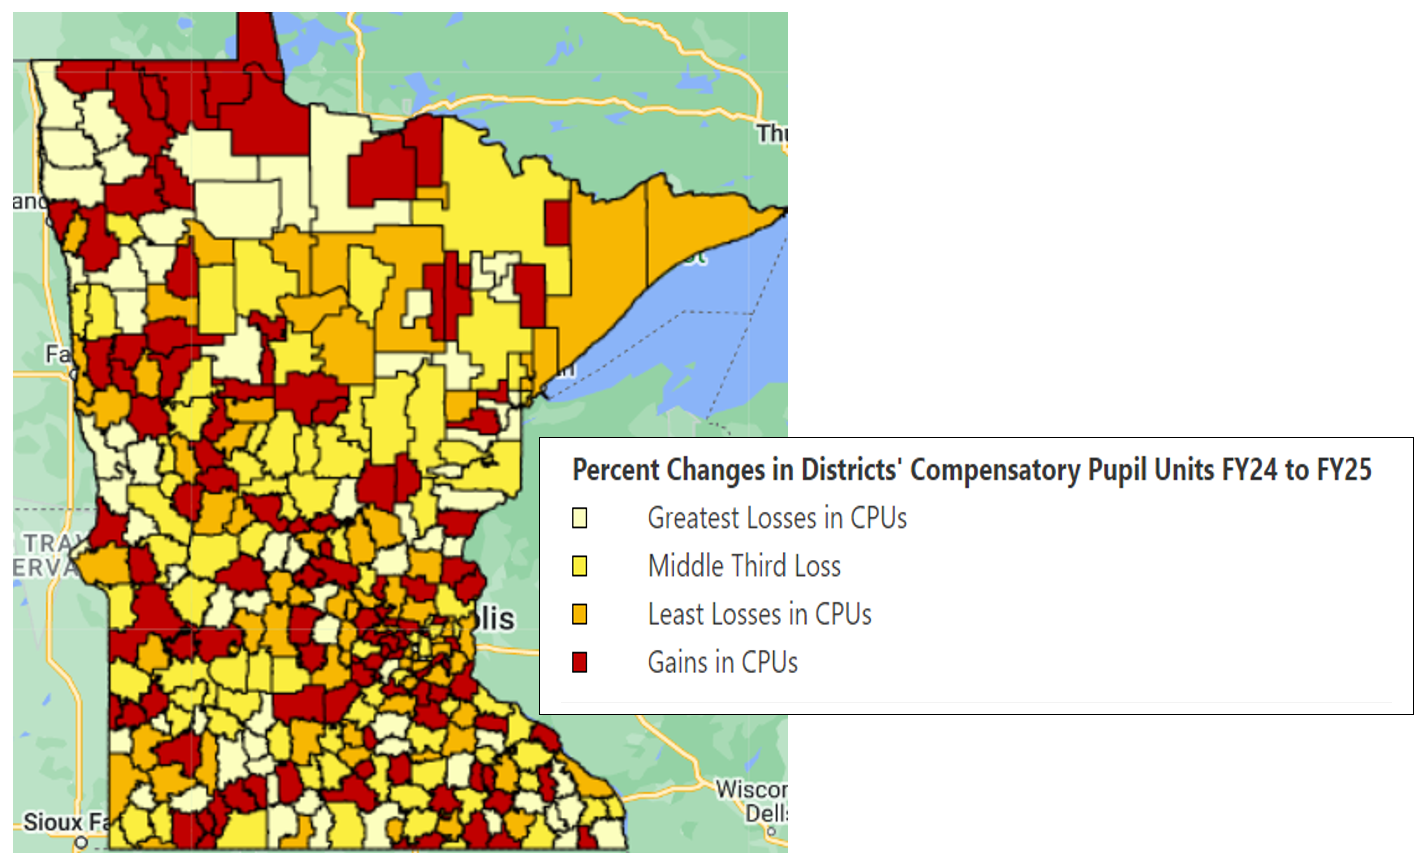
Statewide CPUs dropped by 4,660 or 1.5%. 228 districts experienced a decline in CPUs, while 103 saw an increase from the fall of 2022 to 2023. Of the districts with declining CPUs, 67% also experienced an overall decline in enrollment. Of the districts with increasing CPUs, 64% saw increasing enrollment. The trendlines for CPUs and enrollment are generally in the same direction. Districts with decreasing enrollment are more than likely to see decreasing CPU counts, and the opposite is true for districts with increasing enrollment. But it is clearly not a 1:1 match. CPU counts do not directly mirror enrollment changes.
The range in changes of CPUs from just two years of data are quite large. For all districts, the range is from a loss of 42% CPU to an increase of 25%. It doesn’t make sense to go back past FY24 due to the large change in CPU when Minnesota joined the USDA Demonstration Project adding Medicaid to Direct Certification for Free and Reduced meals. (For more details, see MREA’s Jan 8, 2024 article)
The map below shows the distribution of changes in Compensatory Pupil Units between the fall of 2022 and fall of 2023 (FY24 to FY25). See your district’s change in CPUs here.
In FY26, the hold harmless for CPUs goes away. FY26 Compensatory Revenue will be based on the CPU count done in the fall of 2024. While two years is a short time to see a trend, districts whose sites continue to see losses in CPUs will experience a more significant drop in Compensatory Revenue, because it will be a two year drop from CPUs from the fall of 2022 to 2024. The 228 districts who saw a decrease from FY24 to FY25 are at risk for these decreases, especially the 97 districts who saw decreases in all their sites’ CPUs.
What role do paper applications play in Compensatory Pupil Unit calculations for FY25 and beyond?
For the fall CPU count of 2021 and all previous years, MDE Finance did not record how students were determined to be eligible for Free or Reduced meals. When Minnesota joined USDA’s Demonstration Project for Direct Certification with Medicaid in 2022 (see Jan 8, 2024 article), MDE added a field to record whether students’ eligibility was due to Direct Certification or by paper application. We now have this data for fall of 2022 and 2023. Of course, MDE is dependent on districts coding this information properly at the front end.
For FY24, when Compensatory Revenue calculations were based on fall 2022 counts of Free and Reduced meal eligibility and meals were not universally free to all students, paper applications accounted for 15.5% of CPUs statewide with a district median of 13.1%.
For FY25, when Compensatory Revenue calculations were based on fall 2023 counts of Free and Reduced meal eligibility and meals were universally free to all students for the first time, paper applications still accounted for 11% of CPUs statewide with a district median of 7%.
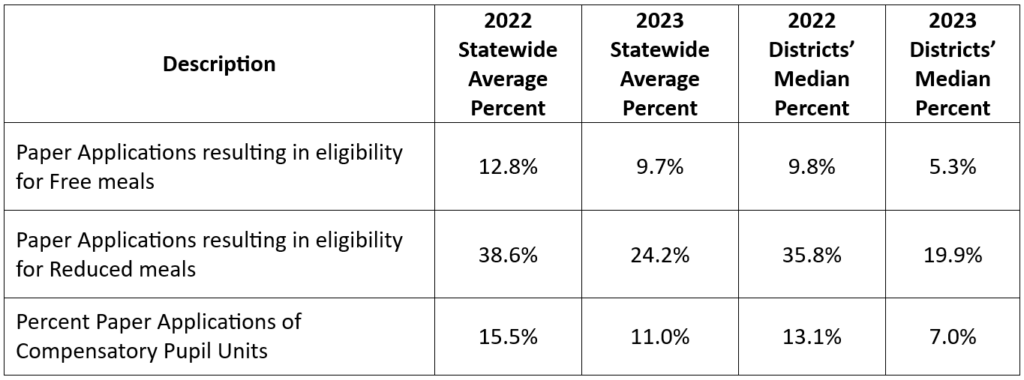
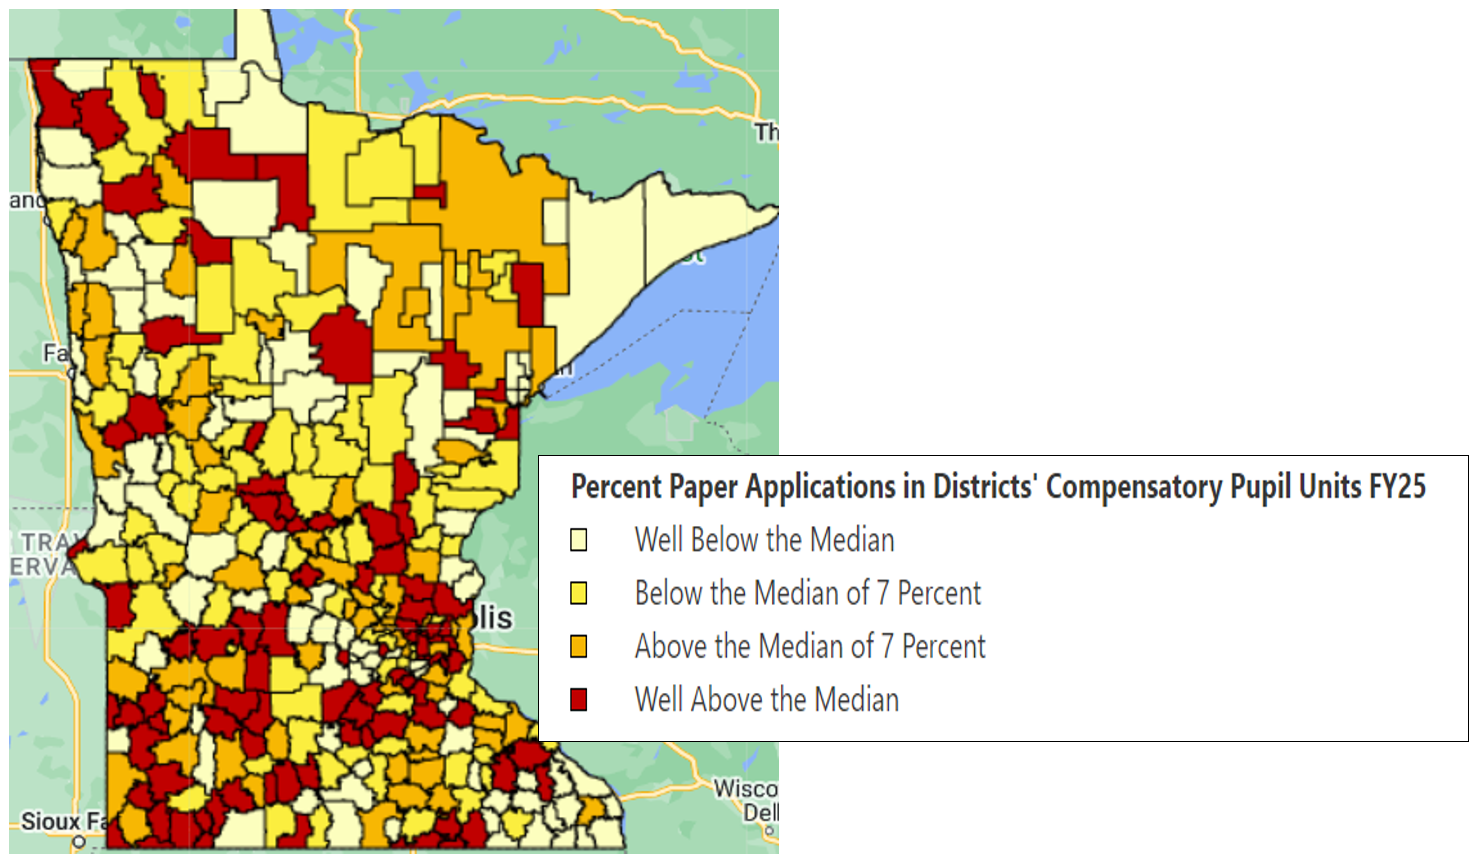
When the statewide percentage of CPUs, or for that matter any Minnesota educational statistic, exceeds the statewide district median, that means that more larger districts are above the statewide median. This can be seen in the map below where Anoka-Hennepin, St. Paul and Minneapolis, as well as other metro districts, are above the median of percentage of paper applications in their CPU counts.
As always, statewide averages and medians obscure the wide district variability of the effect of paper applications on CPUs which ranges from 0% to 56%. The map below shows the distribution. Find your district’s percent of paper applications effect on Compensatory Pupil Units here.
One of the changes the 2023 Legislature made to Compensatory Revenue was to insert this sentence into state statute: “Beginning October 1, 2024, the commissioner shall determine the number of children eligible by means of direct certification to receive either a free or reduced-price meal on October 1 each year.” (MS 126C.10 Subd 3(c)) This affects FY26 and beyond.
If this means that paper applications will no longer count for CPUs next fall, nearly all districts will see decreases in CPUs in FY26. With the current statutes for calculating Compensatory Revenue, districts with higher percentages of paper applications may see significant reductions in Compensatory Revenue.
This potential change along with the decreases in CPUs with the end of hold harmless, would reduce Compensatory Revenue driven by CPUs across the state with very disparate impacts district by district.
Key Take-Aways
- The hold harmless for FY25 will be a Compensatory Revenue increase for all districts and more expensive than the state originally predicted.
- Without the hold harmless, 228 districts would have experienced a decline in CPUs while 103 saw an increase from the fall of 2022 (FY24) to 2023 (FY25).
- In the fall of 2023 for FY25, nearly all districts received and approved paper applications for Free and Reduced meal eligibility which added to their CPUs. The median was 7% of the districts’ CPUs.
- A new statute enacted in 2023 raises questions whether paper applications for Free and Reduced meal eligibility will count towards CPUs beginning in the fall of 2024 for FY26 Compensatory Revenue calculations. If this happens, it could mean a further reduction in CPUs for nearly all districts.