Both Minnesota Gov. Tim Walz and Education Commissioner Mary Cathryn Ricker have spoken of their goal to “freeze the SPED cross subsidy,” so 3 percent and 2 percent on the basic education funding formula are “truly 3 and 2.” When they say freeze, they mean keeping each district’s cross subsidy at its current amount or less in 2020 and 2021.
Is this possible? MREA analyzed data from the Minnesota Department of Education (MDE). Here is the result:
DEFINING CROSS SUBSIDY
The SPED “Cross subsidy” is the difference between a district’s SPED costs and reimbursement from federal and state funds. It essentially is the district’s portion of SPED costs. To compare these costs across the state, the District’s SPED cross subsidy is divided by the number of pupils they serve (ADM).
KEY FINDING #1
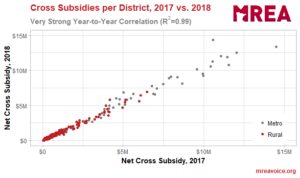
Special education costs for Minnesota school districts — both in terms of total costs and cross subsidies — are highly correlated from year to year. Cross subsidies for school districts in the state nearly matched the their total costs in 2017 (with an R2 value of 0.99 on a scale of zero to one). The same was true for the districts’ total costs between 2017 and 2018.
These figures literally cannot be much more tightly correlated, and the strength of this correlation works in MDE’s ability to deliver on the desire to “freeze the SPED cross subsidy.”
KEY FINDING #2
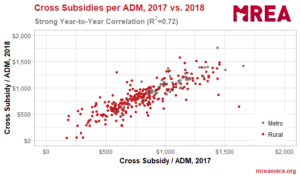
Correlations in year-to-year costs per student (per ADM) are also remarkably strong. Cross subsidies per ADM had R2 values of 0.723 over the same period. Of course, because enrollment and other factors are included in these figures, their correlations are not as tight as the only the costs themselves. Regardless, even statistically speaking, these strong correlations would make prediction of future costs possible.
KEY FINDING #3
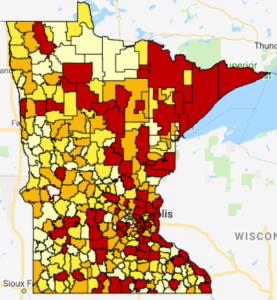 The statewide district median for FY ’18 is $830 per pupil. However there is large variation in the cross subsidy per pupil, as shown by the map to the right. Cross subsidies range is from $45 to over $2,000 per pupil. View interactive map
The total statewide districts’ SPED cross subsidy was $800 million, and when divided by 846,000 students, the statewide average is $962 per pupil. In the metro districts the average is $1,074 per ADM and for the rural districts the average is $862 per ADM.
Those school districts highlighted with red in the map to the right have the highest cross subsidy. The districts with orange follow and exceed the state median. Those in the two shades of yellow fall below the statewide median.
One thing is clear. Districts will have SPED cross subsidy costs going forward. $800 million – $90 million = $710 million. This is an issue that will continue to draw attention and require study and clear thinking to resolve.
CHALLENGE #1
While MDE has sophisticated modeling of districts previous years’ costs upon which it predicts future costs, the last year with known data is FY ’18. The projected modeling begins with FY ’19 (this year) and the governor’s proposals are based on modeling for FY ’20 and ’20 — two and three years after the known data. This time lag is not in MDE’s favor.
Proposals
If you push enough money at the SPED costs so the new money exceeds the expected growth in costs, the chances of keeping all districts at the same or with less cross subsidy increases. The Governor proposed $90 million in ’20-21, the House $117 million and the Senate $0. The Governor and House proposals increase SPED funding in the next biennium ’22-23, while the Senate remains at $0.
The Governor and House increases are above the forecasted increases based on current Minnesota statutes regarding SPED funding. The Senate $0 new money continues state law.
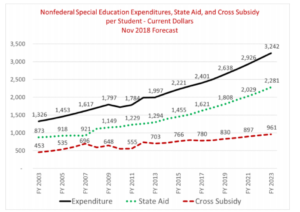
In the November ’18 Forecast Summary, state SPED funding is forecasted to increase $79 million in FY ’20 and $119 million in FY ’21. These amounts are insufficient to hold the cross subsidy steady according to MDE projections of SPED expenditures, as can be seen in this chart from the Feb. ‘19 Education Budget Recommendations.
Next Steps
Despite all the modeling, new money and statistics, there is no guarantee this will work for all districts. Districts’ won’t know their SPED financial responsibility until all the tuition bills for the 19-20 school year arrive into the fall of 2020, and the statewide picture will not become clear until until January of 2021.
View the details of the Governor’s recommendations
View a district run for FY ’20 (Note: the Feb Forecast column is current statute and the Senate proposal)
View a district run for FY ‘21 (Note: the Feb Forecast column is current statute and the Senate proposal)
View House SPED Funding district runs:
Finally, the overall budget negotiations and education conference committee’s work will be key to whether the governor gets to test his claim to “freeze SPED cross subsidies.” MDE can have the best modeling, but if insufficient funds are added to the formula’s the cross subsidies will continue to grow. Learn more
To learn more on SPED costs and funding view the MDE’s Special Education Cross Subsidies Report to Legislature, July 2018.
………………………………..
What is R2?
This statistic indicates the percentage of the variance in the dependent variable that the independent variables. R-squared is a statistical measure of how close the data are to the fitted regression line. It is also known as the coefficient of determination.