Part V – American Indian Education Aid
Throughout the summer, MREA dug into major education revenue streams that were impacted by the outcome of the 2023 legislative session:
- Total General Fund
- Basic Formula Allowance
- Special Education and English Learner Cross Subsidies
- Student Support Personnel Aid and School Library Aid
Today, in the last part of this series, we’ll dive into American Indian Aid, an important revenue stream for many of MREA’s rural member districts. American Indian Aid brings resources to districts aimed to reduce the achievement gap and other inequities for American Indian students.
Districts who report an American Indian student count of 20 or more to MDE are eligible to receive American Indian education aid. The new legislation states that districts that qualify for American Indian Education Aid will receive the greater of (1) the sum of $40,000 plus the product of $500 times the difference between the number of American Indian students and 20, or (2) the amount of American Indian Education grant received in FY15.
For instance, if a district reports 22 American Indian students, their aid would be:
- $40,000 + 500 (22-20)
- $40,000 + 500*2
- $40,000 + 1000 = $41,000
Districts who do not use this aid in the designated fiscal year may carry the revenue forward, and may expend up to half of the remaining funds in the first 6 months of the following fiscal year. The minimum amount of dollars for the American Indian Education Aid per district was increased from $20,000 to $40,000 per year. The revenue increase for this funding stream totals $12,970,000 for FY24 and FY25.
MREA created a map of the distribution of the American Indian Aid increase by district.
See the MREA American Indian Aid map.
There are 180 districts that do not qualify for this aid. A district only needs 20 or more American Indian students to qualify for this aid. Of the districts that qualify, the map shows that all the districts that are above the median/APU are rural districts. By doubling the base aid per district, this categorical revenue should help with providing American Indian services to rural districts who qualify.
There is a clear distinction between Northern and Southern Minnesota. Many rural districts in Northern Minnesota receive this aid, whereas there are only pockets of Southern Minnesota districts who receive the aid. By sheer numbers of students, the metro area schools, and surrounding suburbs qualify, but at below median/APU.
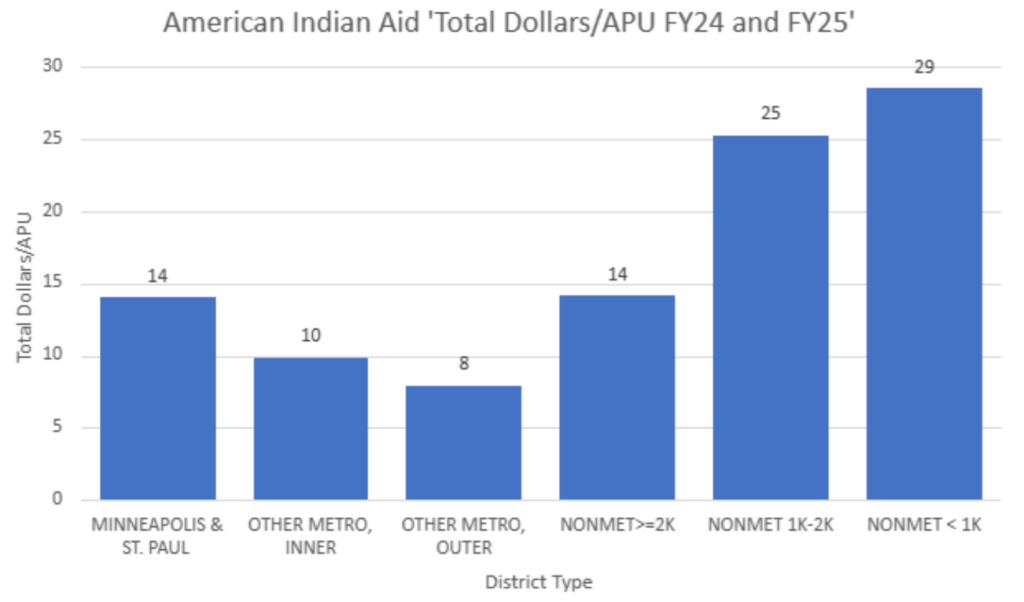 The chart above is another way of looking at the data. It is not apples to apples when comparing to the map. In the map, MREA excluded the districts who do not receive this aid and took the median of the districts who do. For this chart, however, we look at all districts (including those that do not receive aid) and take the average dollars/APU. This graph shows that the smaller, rural districts receive more American Indian Aid/APU.
Key Takeaways
- The minimum of American Indian Aid was doubled as a result of this year’s legislative session. The minimum increased from $20,000 to $40,000.
- Only districts with 20 or more American Indian students qualify for this aid.
- Of the districts who receive the aid, the majority of rural districts are above the median in dollars/APU.